![]()
Mapping Poverty and Well-Being Through Natural Language Processing✽
Guberney Muñetón-Santa, Carlos Andrés Pérez-Aguirre, and Juan Rafael Orozco-Arroyave
Received: November 25, 2024 | Accepted: May 9, 2025 | Modified: May 23, 2025
https://doi.org/10.7440/res93.2025.03
Abstract | Poverty and well-being indexes encompass dimensions that capture meaningful aspects of life worth measuring. These dimensions reflect people’s concerns and priorities, offering insight into their lived experiences. This study identifies dimensions of poverty and well-being directly from people’s everyday language and proposes a novel method for assigning weights to these dimensions based on what people express as important. Using topic modeling techniques within the Natural Language Processing framework, we uncovered key themes people associate with poverty and well-being in their own words. We also applied transfer learning through a zero-shot classification model to assign weights to these dimensions, ranking them by their relevance to the target population studied. In our case studies, the most prominent poverty-related dimensions included lack of opportunities, unemployment, lack of spirit, lack of money, and attempts to get ahead, while the top well-being dimensions identified were living well, meeting basic needs, nourishment, and health. This approach helps pinpoint priority areas for intervention and resource allocation. We recommend using topic modeling techniques when designing multidimensional indicators, as this enables researchers and policymakers to ground social indicators in the voices of the people they aim to serve.
Keywords | artificial intelligence; capability approach; multidimensional poverty; Natural Language Processing; topic modeling; well-being
Mapeando la pobreza y el bienestar a través del procesamiento de lenguaje natural
Resumen | Los índices de pobreza y bienestar abarcan una serie de dimensiones que reflejan aspectos valiosos y susceptibles de cuantificación de las vidas de las personas. Tales dimensiones evidencian sus preocupaciones y prioridades, de manera que ofrecen un acercamiento a sus experiencias. Este estudio identifica las dimensiones de la pobreza y del bienestar directamente en el lenguaje cotidiano y propone un método novedoso para asignarle valor a cada una de acuerdo con lo que las personas consideran importante. Mediante técnicas de modelado de temas, en el marco del procesamiento del lenguaje natural, detectamos las principales temáticas que la gente, en sus propias palabras, asocia con la pobreza y el bienestar. Igualmente, aplicamos la técnica de aprendizaje por transferencia a partir de un modelo de clasificación de disparo cero, con el fin de asignar valor a las dimensiones de estudio y ordenarlas según su relevancia para el grupo poblacional que fue examinado. En nuestros casos de estudio encontramos que las dimensiones relacionadas con la pobreza que más sobresalían eran la falta de oportunidades, el desempleo, la desmotivación, la falta de dinero y los intentos por salir adelante. Por su parte, entre las dimensiones relacionadas con el bienestar hallamos la calidad de vida, la satisfacción de las necesidades básicas, la alimentación y la salud. Este enfoque permite precisar cuáles deben ser las áreas prioritarias para la intervención y la asignación de recursos. Finalmente, recomendamos aplicar técnicas de modelado de temas al momento de diseñar indicadores multidimensionales, pues esto posibilita que los investigadores y los encargados de formular las políticas construyan los indicadores sociales a la medida de las necesidades de las personas a las que buscan servir.
Palabras clave | bienestar; enfoque de capacidades; inteligencia artificial; modelado de temas; pobreza multidimensional; procesamiento de lenguaje natural
Mapeamento da pobreza e do bem-estar por meio do processamento de linguagem natural
Resumo | Os índices de pobreza e bem-estar abrangem uma série de dimensões que refletem aspectos valiosos e mensuráveis da vida das pessoas. Essas dimensões destacam suas preocupações e prioridades, de modo que oferecem uma aproximação de suas experiências. Neste estudo, identificaram-se as dimensões da pobreza e do bem-estar diretamente na linguagem cotidiana e propõe-se um novo método para atribuir valor a cada uma das dimensões de acordo com o que as pessoas consideram importante. Adotando técnicas de modelagem de tópicos, no âmbito do processamento de linguagem natural, detectamos os principais temas que as pessoas, em suas próprias palavras, associam à pobreza e ao bem-estar. Da mesma forma, aplicou-se a técnica de aprendizado por transferência a partir de um modelo de classificação zero-shot, a fim de atribuir valor às dimensões do estudo e ordená-las segundo sua relevância para o grupo populacional examinado. Em nossos estudos de caso, verificamos que as dimensões relacionadas à pobreza que mais se destacaram foram falta de oportunidades, desemprego, falta de motivação, falta de dinheiro e tentativas de progredir. Entre as dimensões relacionadas ao bem-estar, por sua vez, encontramos qualidade de vida, satisfação das necessidades básicas, alimentação e saúde. Essa abordagem permite especificar quais devem ser as áreas prioritárias de intervenção e alocação de recursos. Por fim, recomendamos a aplicação de técnicas de modelagem de tópicos ao elaborar indicadores multidimensionais, pois isso permite que pesquisadores e formuladores de políticas construam indicadores sociais adaptados às necessidades das pessoas que procuram atender.
Palavras-chave | bem-estar; abordagem de capacidades; inteligência artificial; modelagem de tópicos; pobreza multidimensional; processamento de linguagem natural
Introduction
In September 2015, the United Nations General Assembly launched the Sustainable Development Goals (SDGs) for 2030, grounded in that the principle that “no one will be left behind” (United Nations 2015). As part of a broader human development strategy under the 2030 Agenda, the SDGs lay out 17 interconnected goals aimed at eradicating poverty and addressing all forms of inequalities worldwide. This agenda promotes a comprehensive view of development that transcends traditional development metrics, emphasizing the multifaceted nature of poverty and well-being beyond simplistic measures like Gross Domestic Product (GDP). Recognizing that GDP fails to capture the nuances of quality of life (QoL), progress, or poverty, the SDGs adopt a multidimensional perspective, underscoring the need to comprehend the various deprivations and challenges faced by individuals across different contexts and regions.
Traditional global assessments often overlook the specific obstacles individuals encounter when converting resources into meaningful aspects of life, such as education or health. Instead, they rely heavily on indices that measure wealth and resources based on GDP, which often fail to account for contextual variations and different factors influencing people’s ability to utilize resources effectively (Nussbaum 2001). Amartya Sen and Martha Nussbaum developed the capability approach to overcome these limitations by focusing on how people convert resources into capabilities. Personal differences, environmental factors, social climates, and relative consumption patterns all shape this conversion process (Sen 2017). This approach strengthens the concept of human development and aligns with the SDGs’ people-centered strategy by the expansion of individuals’ freedoms to pursue meaningful goals (Fukuda-Parr and Cid-Martinez 2019).
The capability approach integrates well-being dimensions, social indicators, people- focused policies, and social norms evaluation (Robeyns 2017). It shifts focus from market performance to individuals’ lived experiences, prioritizing their freedom to attain valued outcomes (Sen 1999). Its primary goal is to assess individuals’ real opportunities, or capabilities, to achieve valuable “doings and beings” known as functionings (Sen 1985). Well-being depends on individuals’ quality of life and their accomplishments. This study builds on Sen’s capability approach (Sen 1985, 1992, 1999, and 2009) to identify and assign weights to poverty and well-being dimensions, while recognizing the challenge of capturing socially and personally significant aspects that enhance QoL.
A major challenge lies in identifying and assigning weights to intrinsically important value-objects (Sen 1992). Sen proposes participatory methods involving public scrutiny, arguing that individuals themselves best understand their lives and opportunities (Sen 2004). This participatory perspective aligns with Nussbaum’s central list of capabilities as a foundational guide (Nussbaum 2001 and 2011) and connects with the “constitutional approach” to selecting poverty and well-being dimensions, combining structured frameworks with insights from those experiencing poverty (Burchi, De Muro, and Kollar 2014 and 2018, Burchi et al. 2021; Alkire 2002; Sen 2004). While assessing poverty within the capabilities framework offers greater accuracy (Sen 2009), measuring capabilities directly remains challenging, often prompting a shift toward assessing functionings. Still, identifying valuable dimensions remains crucial, aligning with the moral imperative to recognize deprivations that prevent people from leading dignified lives (Sen 1999; Robeyns 2017).
Empirical studies support the emphasis on participatory methods and context-specific evaluations. Sen (1992) and Townsend (1979) view poverty as relative deprivation influenced by socio-spatial realities, necessitating evaluations that incorporate individuals’ voices (Alkire 2013; Narayan et al. 2000; Shaffer 2002; Wisor et al. 2016). The SDGs promote participatory processes that foster collective empowerment (Frediani 2019a). A World Bank study (2018) with over 20,000 poor individuals in 23 countries identified ten poverty dimensions reflecting their perspectives (Narayan et al. 2000). Research by Biggeri et al. (2006) and Wisor et al. (2016) validated capability lists and identified gender-specific poverty dimensions, highlighting variability across contexts. Clark’s studies in South Africa (2000 and 2003) and Greco’s work in Malawi (2018) demonstrate the effectiveness of participatory methods, emphasizing the need for contextually relevant, inclusive approaches.
While qualitative methods like focus groups effectively identify poverty dimensions, they often yield unstructured data that is difficult to analyze and scale consistently. To overcome this challenge, this study applies Natural Language Processing (NLP) techniques—specifically Topic Modeling—to automatically extract relevant insights from interview transcripts. This approach enhances the hybrid perspective by integrating unstructured qualitative data with machine learning, capturing nuanced opinions and experiences of poor individuals more effectively. Unlike manual qualitative analyses, NLP methods offer scalability and reproducibility across diverse settings.
To build meaningful multidimensional indicators, researchers must go beyond identifying poverty dimensions and assign weights that reflect the relative importance of each aspect (Alkire et al. 2015). The normative approach uses expert judgment or community evaluations, often assigning equal weights as in indices such as the MPI and HDI (Alkire and Santos 2013; Angulo et al. 2016; Bank 2018). While straightforward, this method assumes no hierarchy among dimensions, possibly overlooking context-specific priorities. The data-driven approach, in contrast, employs statistical techniques like principal components analysis (PCA) to derive weights from empirical data (Alkire et al. 2015), uncovering patterns for tailored, context-sensitive weightings. For instance, Medellín’s multidimensional QoL index uses weighted PCA (Alkire et al. 2015). However, purely data-driven methods may lack the contextual nuance and participatory insight of qualitative approaches.
The hybrid approach merges normative and data-driven perspectives, using statistical data and survey methods to capture individuals’ deprivations and priorities (Greco 2018). It balances empirical rigor with participatory relevance, ensuring indicators reflect both statistical trends and lived experiences. This study contributes to the hybrid perspective by proposing NLP techniques to analyze interviews from impoverished populations, hypothesizing that language models can encode individuals’ perceptions of poverty and well-being. Utilizing AI-based models, the approach integrates personal opinions with statistical data, enhancing poverty assessments. Advancements in AI, particularly NLP and text mining, allow patterns to be extracted from unstructured data (Eisenstein 2019), facilitating large-scale participation by generating models that reflect people’s words and prioritized concepts.
However, existing language models often reflect biases stemming from training data predominantly originating from affluent regions and mainstream media sources (Bender et al. 2021; Prabhakaran, Hutchinson, and Mitchell 2019; Salvatore, Biffignandi, and Bianchi 2021; Chiquito et al. 2019). As a result, these models may not accurately represent marginalized populations, leading to misrepresentations in poverty assessments (Muñetón-Santa et al. 2022). Researchers can mitigate these biases by incorporating data directly from poor individuals, ensuring that models genuinely reflect their realities. Previous work by Muñetón-Santa et al. (2022) demonstrated the potential of NLP techniques to model poverty levels based on poor individuals’ opinions but assumed that existing poverty dimensions were adequate, neglecting the identification and weighting of dimensions based on participants’ input. This study addresses these gaps by employing Topic Modeling to extract information from interviews, identifying dimensions that describe poverty and well-being from the perspectives of the affected individuals. It also introduces a zero-shot text classification strategy to assign weights to these dimensions. This NLP and AI technique enables models to categorize text into predefined classes without prior training on those specific categories. By leveraging this technique, the study integrates people’s opinions directly into the model, assigning weights to the identified dimensions based on the semantic content of the interviews, even in the absence of labeled training data. This approach enhances the model’s ability to accurately reflect the true perceptions and priorities of impoverished populations.
This paper advances the capability approach by leveraging NLP and Topic Modeling to systematically identify and assign weights to dimensions of poverty and well-being based on direct input from both impoverished individuals and the general population in Medellín, Colombia. By analyzing interview data from these diverse groups, we capture a comprehensive spectrum of perspectives on quality of life and poverty. We introduce a methodology that semi-automatically extracts relevant dimensions using Topic Modeling, and we employ Zero-Shot Text Classification to quantify the weight of each dimension, integrating people’s opinions directly into the model. Our framework merges participatory insights with statistical robustness, addressing limitations of traditional qualitative and quantitative methods. By combining NLP methods with social science theories, we enable modern computational techniques to quantify aspects traditionally considered qualitatively. This approach aims to create more accurate, scalable, and contextually relevant indicators of poverty and well-being that genuinely reflect the lived experiences and priorities of the affected populations, contributing to more effective, inclusive, and SDG-aligned policy development.
Participants and Data Collection
Poverty Database
This is the same corpus from our previous study (Muñetón-Santa et al. 2022), based on data collected in Medellín, Colombia. Interviews were conducted with families participating in Medellín Solidaria: Familias Medellín, a social program aimed at combating extreme poverty. Families were selected using three main inclusion criteria: (i) a low score in the Sisben index—a public policy tool used to identify vulnerable and poor individuals in Colombia; (ii) participation in the program for at least three consecutive years; and (iii) evidence of setbacks in their efforts to overcome poverty.
Data Collection Process
A team of 16 trained social science professionals conducted semi-structured interviews with 367 of 431 families participating in a social program that monitors poverty conditions. These professionals, who visited each family twice a month, interviewed a primary household decision-maker, focusing on four main themes: general definitions of poverty, deprivations, causes, and opportunities. Each theme included guiding auxiliary questions, and responses were consolidated into individual texts per participant. The interviews aimed to capture participants’ perceptions of poverty by exploring the causes they identified, the difficulties they faced, how they obtained resources, their aspirations, and their approaches to decision-making.
Each interview generated a text with a median length of 55 words per participant (ranging from 14 to 609). After pre-processing—which involved removing stop words, punctuation marks, and numerical digits, the median dropped to 27 words (with a range from 8 to 247). This word count excluded anything said by the interviewer. Further details about this corpus can be found in (Muñetón-Santa et al. 2022).
The four themes and their corresponding auxiliary questions included in the semi- structured interviews are included in Table 1.
Table 1. Themes and questions included in the semi-structured interviews
|
Theme |
Questions |
|---|---|
|
General definition of poverty |
What does poverty mean to you? |
|
How would you describe it? |
|
|
Do you consider yourself poor? Why? |
|
|
Deprivations |
What do you feel you are missing in your life? |
|
What would you like to have or experience, but currently can’t? |
|
|
Causes |
Why do you think you are living in your current conditions? |
|
Opportunities |
What do you believe needs to happen for you to improve your situation? |
Source: The authors.
Quality of Life (QoL) Database
This corpus was collected by the public administration of Medellín, Colombia in 2021 as part of the quality-of-life survey conducted each year in the city. The survey is divided into 18 domains related to quality of life, and is used to guide the public policy in the city. Survey respondents—referred to as qualified informants—were chosen for their ability to provide information about the household, they were called qualified informants.
The 2020 version of the survey included two optional open-ended questions intended to obtain information about people’s idea of the meaning of QoL and that of poverty. These questions appeared at the end of the questionnaire and were posed only to those who agreed to participate. Out of 9,400 participants, 849 responded. The survey was conducted by a call-center and the answers to the open-ended questions were recorded and transcribed by the project’s research assistants.
Before pre-processing the corpus, the median value of the number of words per person was 62 (ranging from 4 to 626). After pre-processing, the median value dropped to 21 (ranging from 1 to 251). The counting excluded the interviewer’s words. A total of five samples with less than 4 words were removed from the dataset.
Questions considered in this study: What does quality of life mean? How do you define a poor person and a non-poor person?
Descriptive Analysis
The database contains approximately 190 variables related to household QoL. Demographic variables help characterize both the informants and their households. Respondents to the open-ended questions came from 19 of the city’s 21 districts. Of these respondents, 77% were women and 22.3% were men—a distribution commonly observed in household surveys, as women are more likely to be responsible for domestic tasks. This proportion also closely mirrors that of the broader sample included in the full QoL survey.
The average age of the respondents was 55 ± 16 years. Of those surveyed, 52.3% identified as the head of household. The remaining 47.7% included spouses or permanent partners of the head of household (26%), children of that union (11.8%), siblings of the head of household (3.1%), parents (3%), and other relatives (3.8%).
In Colombia, socioeconomic status is typically measured using a stratification system called estrato, which groups the population into six hierarchical levels. Level one represents the lowest socioeconomic status and level six represents the highest. Of the respondents, 53.9% belongs to the two lowest levels; 31.9% to the third level; and the remaining 14% to the next three levels; with level six, representing only 0.94%. Further details are shown in Table 2. Figure 1 illustrates the distribution of survey participants according to their estrato. It is worth noting that this distribution is very similar to the one observed in the city’s full QoL survey. To further assess this, we ran a simulation comparing the proportions, then calculated the Highest Density Intervals (HDI) for the 849 respondents who answered the open-ended questions and the remaining survey participants. The results showed no statistically significant difference in the proportion of women (95% HDI: [-0.02, 0.03]) or in the proportion of those with their own housing (95% HDI: [-0.02, 0.04]). However, the proportion of respondents from lower socioeconomic strata (1, 2 and 3) was slightly lower in the open-ended question sample (95% HDI: [-0.06, -0.01]), indicating a potential underrepresentation of these groups in the analyzed texts.
Table 2. Demographic profile of the respondents in the QoL database
|
Head of household |
Spouse or partner |
Children |
Other |
Overall |
|
|---|---|---|---|---|---|
|
(N=444) |
(N=221) |
(N=100) |
(N=84) |
(N=849) |
|
|
Sex |
|||||
|
Men |
140 (31.5%) |
3 (1.4%) |
31 (31.0%) |
15 (17.9%) |
189 (22.3%) |
|
Women |
304 (68.5%) |
218 (98.6%) |
69 (69.0%) |
69 (82.1%) |
660 (77.7%) |
|
Age |
|||||
|
Mean (SD) |
59.3 (13.6) |
56.0 (13.4) |
36.4 (15.4) |
54.0 (20.0) |
55.2 (16.1) |
|
Median [Min, Max] |
60.0 [24.0, 89.0] |
57.0 [18.0, 86.0] |
31.5 [18.0, 73.0] |
60.0 [18.0, 94.0] |
58.0 [18.0, 94.0] |
|
Education |
|||||
|
None |
53 (11.9%) |
16 (7.2%) |
3 (3.0%) |
10 (11.9%) |
82 (9.7%) |
|
Primary School (1º to 5º) |
156 (35.1%) |
72 (32.6%) |
6 (6.0%) |
22 (26.2%) |
256 (30.2%) |
|
High School (6º to 9º) |
47 (10.6%) |
28 (12.7%) |
6 (6.0%) |
6 (7.1%) |
87 (10.2%) |
|
High School (10º to 13º) |
79 (17.8%) |
51 (23.1%) |
42 (42.0%) |
25 (29.8%) |
197 (23.2%) |
|
Technical (Two years) |
27 (6.1%) |
14 (6.3%) |
17 (17.0%) |
4 (4.8%) |
62 (7.3%) |
|
Technological |
28 (6.3%) |
20 (9.0%) |
5 (5.0%) |
1 (1.2%) |
54 (6.4%) |
|
Undergraduate |
36 (8.1%) |
15 (6.8%) |
17 (17.0%) |
11 (13.1%) |
79 (9.3%) |
|
Postgraduate |
18 (4.1%) |
5 (2.3%) |
4 (4.0%) |
5 (6.0%) |
32 (3.8%) |
|
Socioeconomic status |
|||||
|
1 |
37 (8.3%) |
20 (9.0%) |
6 (6.0%) |
7 (8.3%) |
70 (8.2%) |
|
2 |
207 (46.6%) |
100 (45.2%) |
44 (44.0%) |
37 (44.0%) |
388 (45.7%) |
|
3 |
133 (30.0%) |
70 (31.7%) |
40 (40.0%) |
28 (33.3%) |
271 (31.9%) |
|
4 |
36 (8.1%) |
14 (6.3%) |
6 (6.0%) |
3 (3.6%) |
59 (6.9%) |
|
5 |
30 (6.8%) |
12 (5.4%) |
4 (4.0%) |
7 (8.3%) |
53 (6.2%) |
|
6 |
1 (0.2%) |
5 (2.3%) |
0 (0%) |
2 (2.4%) |
8 (0.9%) |
Source: Authors based on collected data.
Note that 9.7% of the respondents reported having no formal education, 30.2% completed primary school, and 33.4% reached high school. Another 26% received technical training, while only a small number had university degrees (Table 2). The figures indicate that there is no evident bias, as the respondents to the two open-ended questions show similar educational patterns to those who answered the full survey.
General Approach
This study analyzes two corpora on poverty and QoL as illustrated in Figure 1. Interview recordings were transliterated, and responses concatenated. Three topic modeling methods were employed: a counting-based model, Correlation Topic Model (CTM), and BERTopic (Grootendorst 2020). The hypothesis posits that the identified topics relate to poverty dimensions, leading to the selection of categories that best represent dimensions of poverty and QoL. Subsequently, the Zero-Shot Text Classification (0Shot-TC) strategy (Yin, Hay, and Roth 2019) was employed to assign weights to the topics via probabilities, reflecting the importance placed on each category by interviewees. The following sections present the methodology in detail.

Source: The authors.
Topic Modeling Algorithms
Topic modeling extracts latent topics from a corpus of documents, defining each topic as a multidimensional distribution over corpus words (Blei, Ng y Jordan 2003). By applying clustering methods, it condenses extensive text into manageable segments. The method assumes that the same set of topics appears across all participants, making it possible to identify consistent weights for each dimension. Topic models encompass three primary approaches: (i) counting-based algebraic transformations, (ii) probabilistic techniques such as CTM, and (iii) neural network methods like BERTopic (Grootendorst 2020). This study draws on all three to offer a comprehensively analysis of the information distribution from the interviews.
Counting and Algebraic Transformation Methods
The bag-of-words approach represents documents as vectors of word counts, ignoring word order. While Term-Frequency Inverse-Document-Frequency (Tf-Idf) (Salton and Buckley 1988) is another common method, we chose not to use it. Tf-Idf depends on speakers using distinct vocabularies—a condition unlikely given our participants’ low levels of formal education. As a result, Tf-Idf scores tended to approach zero. To overcome this “vanishing score” issue, we applied the weighted log-odds ratio with an informative Dirichlet prior (Monroe, Colaresi, and Quinn 2017) and standardized word statistics using z-scores of the log-odds ratio (Silge and Robinson 2017).
The model treats the word counts y in the corpus as a multinomial distribution, i.e., y∼Multinomial(n,π), where 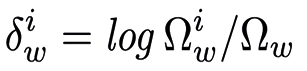 represents the total word count across the lexicon W, and π is a vector with the mutually exclusive probabilities associated to different groups of words. If we define the baseline log-odds ratio between the word w and the first one as
 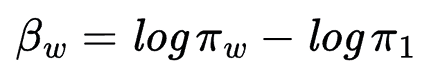 , w=1,2,…,W, then the likelihood function of the log-odd ratio can be expressed as:
Although the analytical solution for the maximum likelihood  of the word w in the i-th document can be simplified as
  , where
  , The typical and robust approach assumes a Dirichlet prior for the distribution of \( \pi \), i.e., \( \pi \sim \text{Dirichlet}(\alpha) \), where \( \alpha \) is a \( W \)-vector with elements \( \alpha_w > 0 \) that can be defined arbitrarily as \( \alpha_w = 0.01, \forall w \) (Monroe, Colaresi, and Quinn 2017).
The Bayesian estimate for the analytical solution of the likelihood is now  , where
  .
.
The resulting model enables the estimation of uncertainty in word usage odds. If we denote the odds of a word \( w \) as \( \Omega_w = \frac{\pi_w}{1 - \pi_w} \). By using the log-odds ratio defined as it is possible to identify how the use of a word w in the document i differs from its use in all documents. To compare between documents i and j, the log-odds ratio of word w is defined as  . Further details of the mathematical procedure can be found in (Monroe, Colaresi, and Quinn 2017). This approach is recommended for comparing groups of documents that likely discuss similar topics, as in scenarios where everyone discusses poverty and quality of life. The metric is easy to interpret: positive log-odds indicate a stronger tendency to use a word, negative log-odds indicate the opposite (Silge and Robinson 2017).
There are two main algorithms based on statistical distributions to identify topics as latent variables. LDA is widely used in topic modeling, employing the bag-of-words approach without considering temporal context (Blei, Ng y Jordan 2003). CTM is an extension that replaces the Dirichlet distribution with a logistic normal one, allowing correlations between topics (Lafferty and Blei 2006). We chose to use CTM since the topics of interest, such as poverty and quality of life, are highly correlated; thus, each document is represented as a vector of topic proportions.
The topics in a text are defined as \( \beta \), therefore a set with \( K \) topics can be denoted as \( \beta_{1:K} \). Additionally, each document \( d \) is associated with a topic proportions \( \theta_d \), i.e., it is the distribution over topic indices and reflects the probability for the corresponding set of words to be drawn from each topic in the collection. The logarithmic quotient between the proportion of the \( i \)-th document with respect to the proportion over the whole \( K \) documents is given by  .
.
Correlations among topics are included in the CTM model by using a logistic normal distribution as the distribution of topic proportions. Notice that \( \eta \) considers the logarithm of the distribution of topic proportions per document, while \( \mu_K \) and \( \Sigma_{K \times K} \) represent the mean vector and covariance matrix over the topics.
Thus, according to the CTM model, an N– word document arises from the following stages:
- Draw \( \eta_d \mid \mu, \Sigma \sim \mathcal{N}(\mu, \Sigma) \)
- For \( n \in 1, \dots, N_d \):
- Draw topic assignment \( Z_{d,n} \mid \eta_d \) from \( \text{Mult}(f(\eta_d)) \). Where \( f(\eta) \) is a function that maps a natural parameterization of the topic proportions to the mean parameterization given by
 .
. - Draw word \( W_{d,n} \mid \{Z_{d,n}, \beta_{1:K}\} \sim \text{Mult}(\beta_{Z_{d,n}}) \).
- Draw topic assignment \( Z_{d,n} \mid \eta_d \) from \( \text{Mult}(f(\eta_d)) \). Where \( f(\eta) \) is a function that maps a natural parameterization of the topic proportions to the mean parameterization given by
To estimate the parameters of the CTM model, the posterior distribution of the latent variables has to be computed for each document. However, this leads to an intractable problem because the distribution of the topic proportions \( p(\eta \mid \mu, \Sigma) \) does not conjugate with the distribution of the topic assignments \( p(Z_n \mid \eta) \). To address this limitation, the authors in (Blei and Lafferty 2007) proposed the use of a variational method to optimize free parameters of the distribution over the latent variables.
We deliberately chose not to lemmatize the terms, as preserving the exact forms of expression was crucial for our bigram analysis. In this analysis, context and specific forms of expression (such as casa propia versus tener casa) are critical for understanding the dimensions prioritized by participants. Although lemmatization might have increased term frequencies by clustering morphological variants, it would also have diluted the semantic nuances that are relevant to our contextual analysis, resulting in less consistent clusters (Schofield et al. 2017). It is also important to note that transformer-based models such as BERTopic, which were used in later stages of our analysis, can process morphological variants efficiently without requiring prior lemmatization thanks to their contextual embedding architecture.
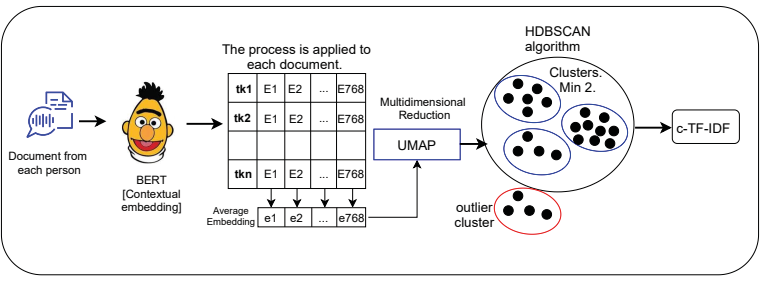
The BERTopic algorithm (Grootendorst 2020) illustrated in Figure 2 addresses the limitations of the bag-of-words approach by leveraging BERT-based contextual embeddings (Devlin et al. 2019) combined with average pooling, dimensionality reduction via UMAP, cluster analysis using HDBSCAN, and an adapted Tf-Idf method (Salton and Buckley 1988). It uses Sentence-BERT (Reimers and Gurevych 2019) to create a single vector per document through mean pooling. This approach facilitates the extraction of meaningful clusters, including the identification of outliers. For cluster interpretation, BERTopic implements cluster Tf-Idf (c-Tf-Idf) to identify key tokens within each cluster. Notably, BERTopic does not need to predefine the number of clusters, increasing its generality and reducing bias.
Figure 2. BERTopic configuration considered in this study
Source: The authors.
In BERTopic implementation, we used the multilingual XLM-RoBERTa model alongside UMAP for dimensionality reduction and HDBSCAN with its default configuration. We observed overlapped terms between different clusters—an expected outcome when working with corpora that exhibit limited semantic variability. Rather than viewing this overlap as noise, we interpreted it as evidence of the cross-cutting relevance of certain bigraphs, which strengthens their value as potential dimensions. The c-TF-IDF representation highlights the distinctive terms of each cluster, making it more effective for identifying relevant aspects in an unsupervised manner than for enforcing strict thematic boundaries. We acknowledge the limitations of applying models such as XLM-RoBERTa to local contexts. While all the words in our corpus were identified by the model, this may not fully capture the nuances of Colombian Spanish or the specific expressions related to poverty in Medellín. These models were predominantly trained using data from developed countries, which could introduce biases in the representation of local concepts of poverty. Similarly, differences in educational levels may affect expressivity, favoring certain forms of articulation. We believe that developing specific models for regional socioeconomic contexts is an important area for future research.
Zero-shot Text Classification (0Shot-TC)
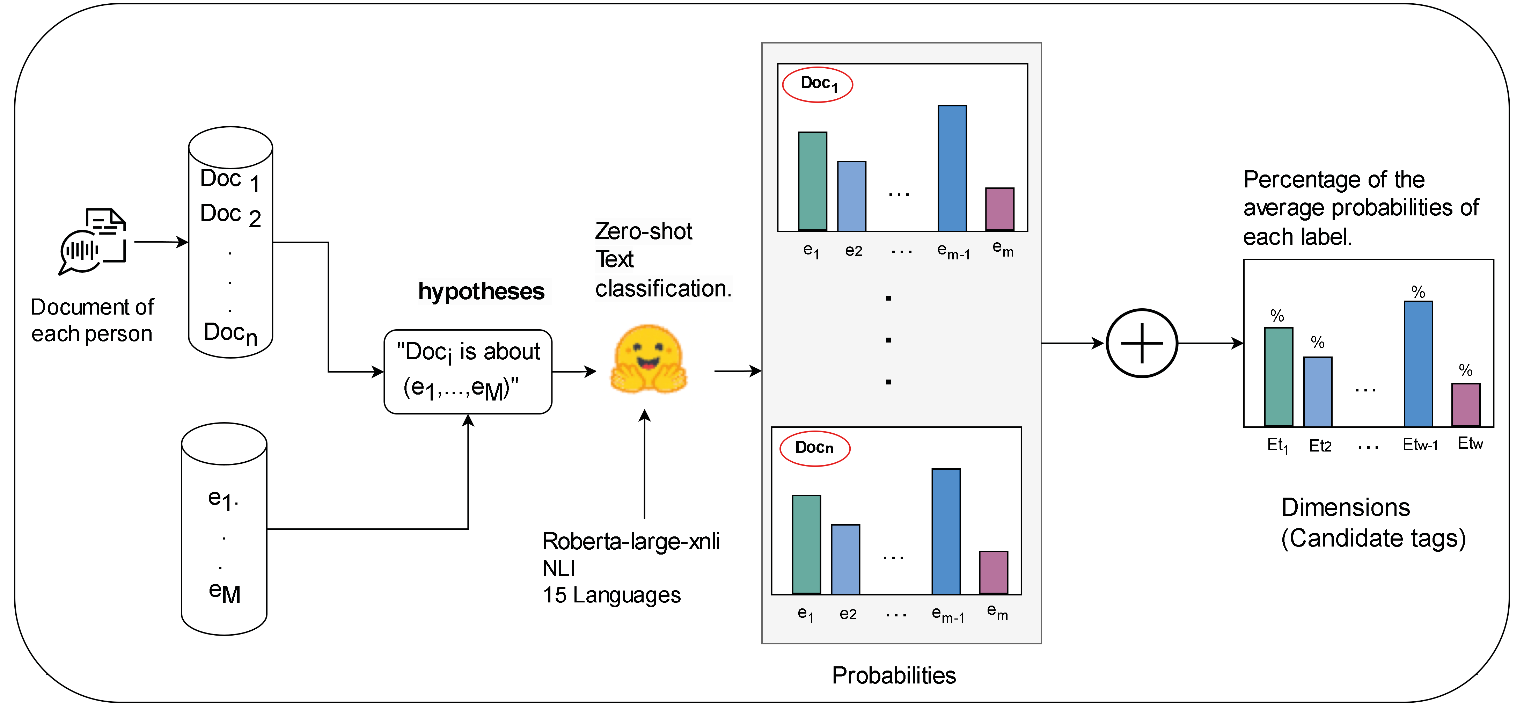
The 0Shot-TC technique (Figure 3) operates on two principles: (i) partially unseen labels (restrictive definition) and (ii) completely unseen labels (open definition). Our problem aligns with the second principle (Yin, Hay, and Roth 2019). We begin by processing each person’s text documents to generate hypotheses such as “This document is about [candidate labels].” These hypotheses are evaluated using the multilingual Roberta-large-xnli NLI model to assign probabilities to each label. The goal is to simulate human reasoning by constructing a classifier that responds to these hypotheses. For example, to determine whether a text relates to “poverty,” we use the hypothesis “This is a text about poverty.” Aggregating these probabilities calculates the average percentage for each label, offering a comprehensive understanding of the candidate labels present. This method provides a flexible way to interpret and classify semantically similar concepts without prior specific training.
Source: The authors.
Zero-shot text classification is based on the semantic representation of transcriptions and labels in a common space. Let \( T = \{ t_1, t_2, \ldots, t_N \} \) be the set of transcriptions to be classified, and \( E = \{ e_1, e_2, \ldots, e_M \} \) be the set of possible labels. The zero-shot classification process can be mathematically represented as follows:
- Semantic Representation: Each transcription \( t_i \) and each label \( e_j \) are projected into a vector space using an embedding function \( \phi \). Thus, \( \phi(t_i) \in \mathbb{R}^d \) and \( \phi(e_j) \in \mathbb{R}^d \), where \( d \) is the dimension of the vector space.
To obtain the semantic representation of transcriptions and labels, we used BERT. Given an input text \( x \), BERT generates a vector representation \( \phi(x) \), where each element of the vector captures contextual information based on adjacent words and the overall meaning of the text. Mathematically, this can be expressed as:
where \( f_{\text{BERT}} \) represents the BERT model and \( \theta \) are the model parameters adjusted during pretraining. The embedding function \( \phi(x) \) transforms both transcriptions and labels into vectors in a high-dimensional space, allowing direct comparisons through similarity measures.
- For each transcription \( t_i \), the similarity with each label \( e_j \) in the vector space is calculated. In this work, we use cosine similarity, defined as:
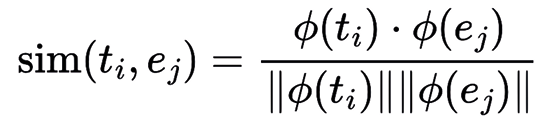
where \( \phi(t_i) \cdot \phi(e_j) \) represents the dot product between the vectors, and \( \| \cdot \| \) denotes the Euclidean norm.
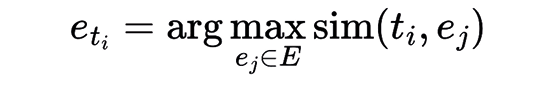
- Label Assignment: The label \( e_j \) that maximizes the similarity with the transcription \( t_i \) is assigned to that transcription. That is, the assigned label \( \hat{e}_{t_i} \) is:
In the pre-processing phase, documents were tokenized, and stop words were removed using the Spanish Snowball source1. Text cleaning involved eliminating punctuation, digits, and misspellings, while stemming was excluded due to inconsistent topics (Schofield et al. 2017). Unigrams, bigrams, and trigrams were compared for semantic coherence, leading to the selection of bigrams for all experiments. While trigrams could theoretically capture more contextual nuances, their frequency in our specific corpus was significantly lower, leading to fewer consistently relevant trigrams and potentially a loss of generalizability. Bigrams offered an optimal balance between semantic richness and sufficient frequency for robust analysis. Details of the experiments and their results are presented below.
Experiment 1: Using Counting and Algebraic Transformation Approaches
The descriptive analysis revealed the diversity of domains where people focused their concern, for example, on the important role of having somewhere to live for poor people and living well as a point of reference for quality of life. Figure 4 adds information to the bigram counts to analyze the most important domains in the poverty and QoL corpus, respectively. Notice the systematic occurrence of concepts like tener casa (having a place to live), tener empleo (to have employment), salir adelante (getting ahead), tener una buena salud (to have good health), pobre de espíritu (poverty of spirit), and others.
Figure 4. Top count bigrams after removing stop words, comparing poverty (Left) and quality of life (Right) databases

Source: The authors.
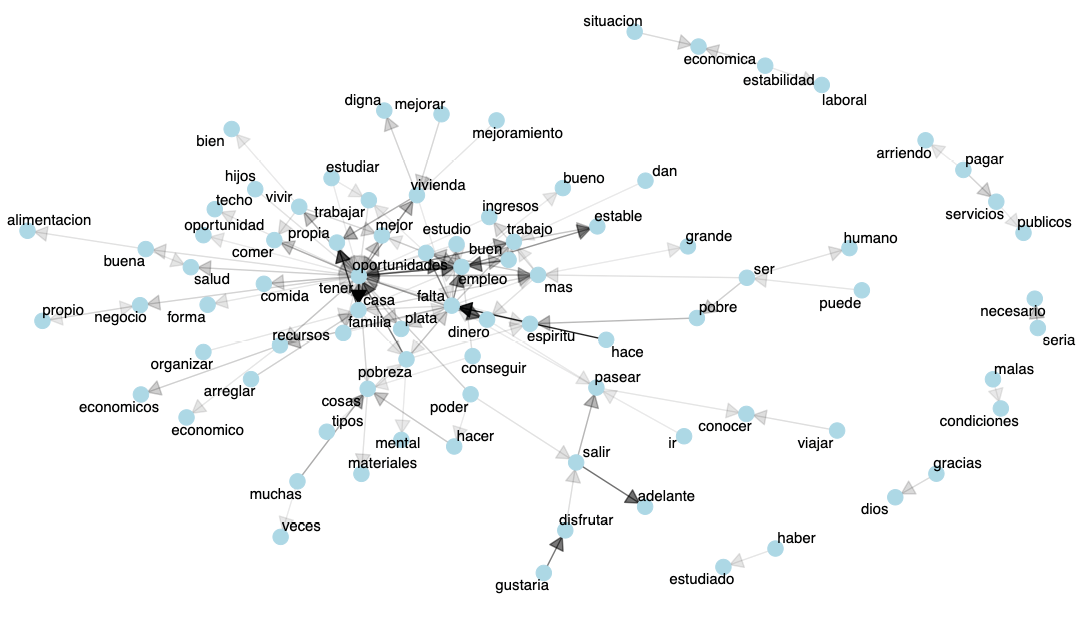
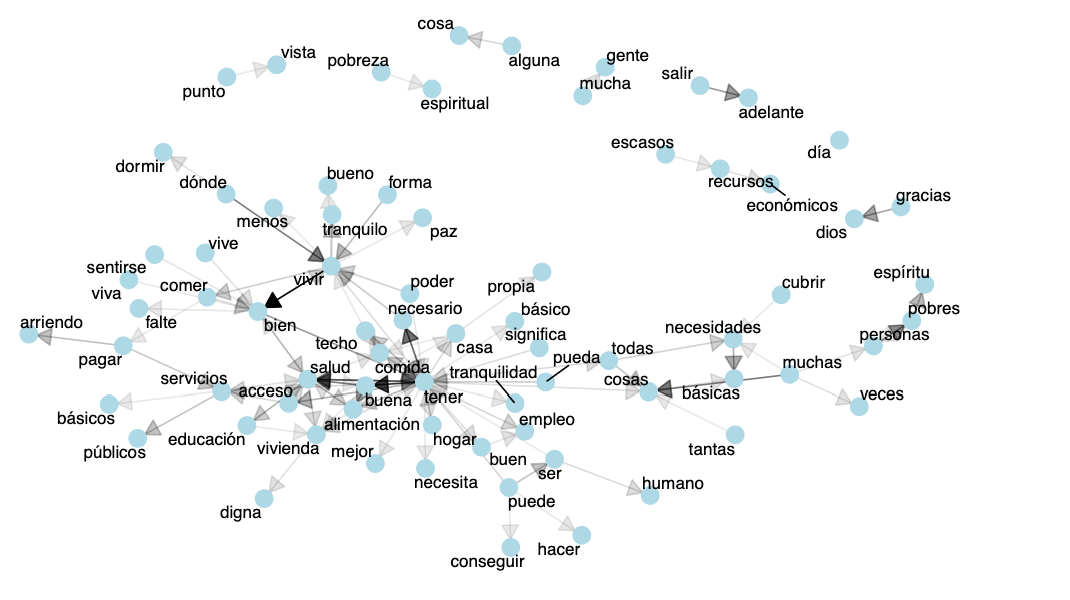
Figures 5 and 6 illustrate the semantic fields resulting from the words processed using unigrams. The graphs work as a type of Markov representation: they include the most common thematic nodes in the corpus and use directed lines to show how those themes relate to one another. The strength of such a relationship—measured by how often it appears in the corpus—is represented in the width of the connecting lines.
In the poverty database, the central node revolves around owning a house. In contrast, the QoL database highlights key nodes in the semantic field of health, nourishment, having enough food, and well-being. These word chains help clarify the context surrounding each node’s semantic field. Notice that the word chains help clarify the semantic context of each node. For example, in the poverty database, the semantic field related to housing includes words like tenure, property, order, repair, lack, and dignified. Another chain, linked to the idea of enjoyment, features words such as going out, going for a walk, discovering, and traveling. A similar pattern appears in the QoL database, where the key concepts closely align with those from the poverty database. These descriptive patterns help identify stronger candidate labels that match the contextual meaning used in the 0Shot-TC model.
Figure 5. Most frequent pairs of words for the poverty corpus
Source: The authors.
Figure 6. Most frequent pairs of words for the QoL corpus
Source: The authors.
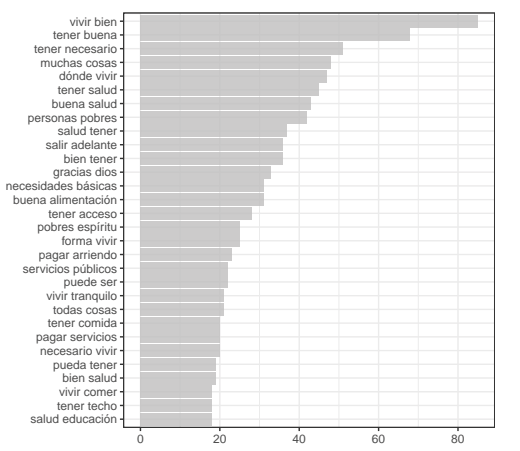
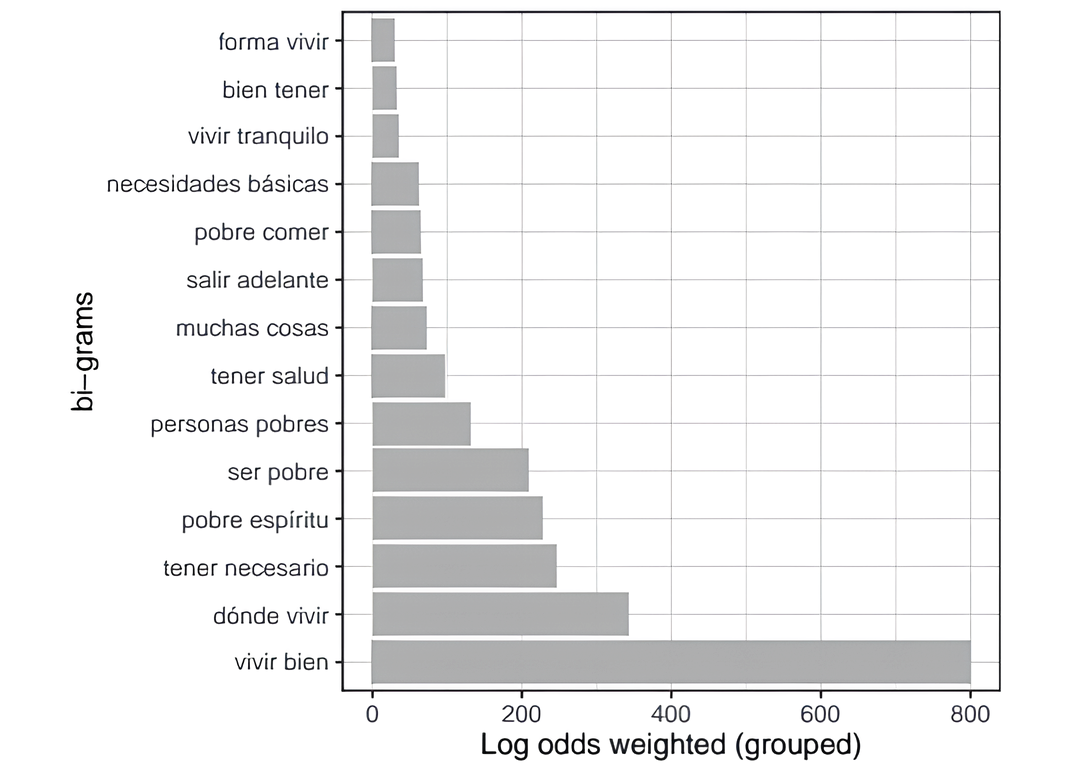
For the descriptive analysis, we also calculated the log-odds ratio weighted by a prior (Monroe, Colaresi, and Quinn 2017) to account for sampling variability in the databases. Figure 7 presents the weighted log-odds for documents in the poverty and QoL databases. The results are consistent with the ones obtained in the co-ocurrence approach. From the perspective of the capability approach, these two findings suggest a strong internal consistency within each corpus—that is, documents in the poverty database tend to reflect similar concerns, as do those in the QoL database. This indicates overlapping social values or a shared understanding of the most important aspects of life. According to the weighted log-odds results shown in Figure 7, the most prominent bigram in the poverty database is tener casa (having a place to live), followed by the bigram falta de dinero (lack of money). In the QoL database, the most important bigram is vivir bien (living well), followed by dónde vivir (where to live).
Figure 7. Sum of bigram weighted log-odds. Poverty database (Left) and quality of life database (Right)

Source: The authors.
Our objective is to identify dimensions or objects of value that individuals have reason to consider meaningful. Accordingly, the list of most relevant categories selected, given their strong concurrence, are further confirmed by the log-odds weights. Therefore, the candidate dimensions selected from the counting approach for the poverty corpus were: casa propia (owning a house), salir adelante (getting ahead), dinero (money), empleo (employment), falta de oportunidades (lack of opportunities), salir a disfrutar (going out to enjoy life), and pobre de espíritu (poverty of spirit). For the QoL corpus, the selected candidate dimensions were: vivir bien (living well), necesidades básicas (basic needs), servicios públicos (public services), vivir tranquilo (living in peace), tener casa (having a place to live), buena comida (good food), salir adelante (getting ahead), and pobre de espíritu (poverty of spirit).
Notice that the concepts or dimensions related to education and health do not appear consistently in the poverty database. As the following experiments will show, although these elements are widely recognized as essential for evaluating human development, the automated methods used in this study do not systematically identify them when analyzing the poverty database alone.
Experiment 2. Correlated Topic Model (CTM)
The pre-processed document frequency matrix obtained from the bigrams was used as input for the CTM algorithm. For topic modeling based on probabilistic methods, we applied the Dirichlet/multinomial mixtures extension of bigram models (Blei, Ng y Jordan 2003). To compare and select optimal number of clusters k∈2,⋯, 20 we relied on perplexity scores—lower perplexity values indicated better model performance. It is important to note that most topic modeling algorithms, including CTM, do not offer a well-defined criterion for selecting k (Vayansky and Kumar 2020).
We evaluated topic coherence using a combination of criteria: (i) we examined the overlap of high-probability words across topics. When topics shared similar key terms, we opted for a smaller number of topics to reduce redundancy. (ii) In parallel, we used the R package ldatuning (Nikita 2020) to fine-tune the LDA parameters by evaluating different values for the number of clusters k. The implementation provided default coherence metrics commonly used in NLP and topic modeling, such as those proposed by Arun et al. (2010), Cao et al. (2009), and Deveaud, SanJuan, and Bellot (2014). These metrics follow a similar rationale to perplexity: the optimal number of clusters was selected by identifying either the minimum (as recommended by Arun et al. [2010] and Cao et al. [2009]), or the maximum (as indicated by Deveaud, SanJuan, and Bellot [2014]) value, depending on the specific metric.
Selecting Number of Topics for CTM
The perplexity analysis for different values of k in both the poverty and QoL databases revealed a decreasing trend as the number of topics increases, but no clear elbow point was observed to guide the selection of k. Established algorithms for determining the optimal number of topics (Arun et al. 2010; Cao et al. 2009; Deveaud, SanJuan, and Bellot 2014) did not provide definitive criteria, as their measures were either noisy or lacked a clear minimum. To address this limitation, we tested alternative values of k (4, 6, and 8) and visually inspected topic coherence and overlap using the LDAvis tool in R (Sievert and Shirley 2014).
The results after summarizing, using multidimensional scaling to assess topic distances and word probabilities, helped us determine that k=6 for the poverty database and k=4 for the QoL database provided semantically coherent topics without redundancy. Selecting a markedly different k could either result in topics too broad to be informative or too granular and overlapping, thereby affecting the clarity of the identified dimensions. Since there is no consensus on how to measure interpretability (Madsen, Reddy, and Chandar 2021), we relied on social and semantic evaluation to select the optimal number of topics, ensuring that the topics were informative and meaningful for human interpretation.
Correlated Topic Model Results
The results indicate that the topics are not mutually exclusive, as the top words appear repeatedly across different topics. High-probability tokens appear simultaneously in multiple documents, suggesting semantic cohesion within the corpus. Since all interviewees discussed similar themes, our aim is to summarize the main aspects that concern them most. As a result, we observed the same words associated with multiple topics carrying roughly equal weights. To understand group differences, we selected a limited number of topics or clusters and avoided overlapping terms when choosing candidate labels.
The top bigrams in the poverty database using k=6 topics confirm findings from the counting approach. The topics are correlated with no clear distinctions among them. Bigrams with the highest probabilities relate to owning a house and employment (Topics 2, 3, and 4). General aspects like salir adelante (getting ahead), interpreted as progressing, also appear. Additionally, falta de oportunidades (lack of opportunities) emerges in the top bigrams across all topics. An important aspect highlighted by poor individuals is the lack of money, resources, or income (falta de dinero, recursos o ingresos). Specific bigrams include deseo disfrutar (wanting to enjoy life) (Topics 2, 3, 4), mejor vida (better life) (Topics 1, 3), and salir a pasear (going out to visit places) (Topic 4). With lower co- occurrence and probability, the concepts pobre de espíritu (poverty of spirit) appear in topics 1 and 5, and buena salud (good health) in topic 4.
In sum, the candidate labels extracted with CTM are: owning a house, having a job, getting ahead, lack of opportunities, lack of money or resources, wanting to enjoy life, better life, going out to visit places, poverty of spirit, and health. Therefore, the candidate dimensions selected were: casa propia (owning a house), empleo (employment), salir adelante (getting ahead or progressing), falta de oportunidades (lack of opportunities), falta de dinero o recursos (lack of money or resources), pobre de espíritu (poverty of spirit), salud (health), deseo disfrutar (wanting to enjoy life). Note that this last dimension is a bigram related to salir a pasear (going out to visit places).
The top bigrams in the QoL database, using k=4 clusters, are related with vivir bien (living well) and appeared in all clusters with high β probability, salir adelante (getting ahead or progressing) with high β parameter in topics 1, 3 and 4. Some bigrams that occur in different clusters are related to: salud (health) (1, 2, 3, 4), tener comida (to have food) (1, 2, 4), necesidades básicas (basic needs) (2, 3, 4), casa propia (owning a house) (1, 2, 3, 4). The selected candidate dimensions were: vivir bien (living well), salud (health), estar alimentado (to be well nourished), necesidades básicas (basic needs), salir adelante (getting ahead or progressing), tener casa (having a place to live), vivir tranquilo (living in peace), pobre de espíritu (poverty of spirit).
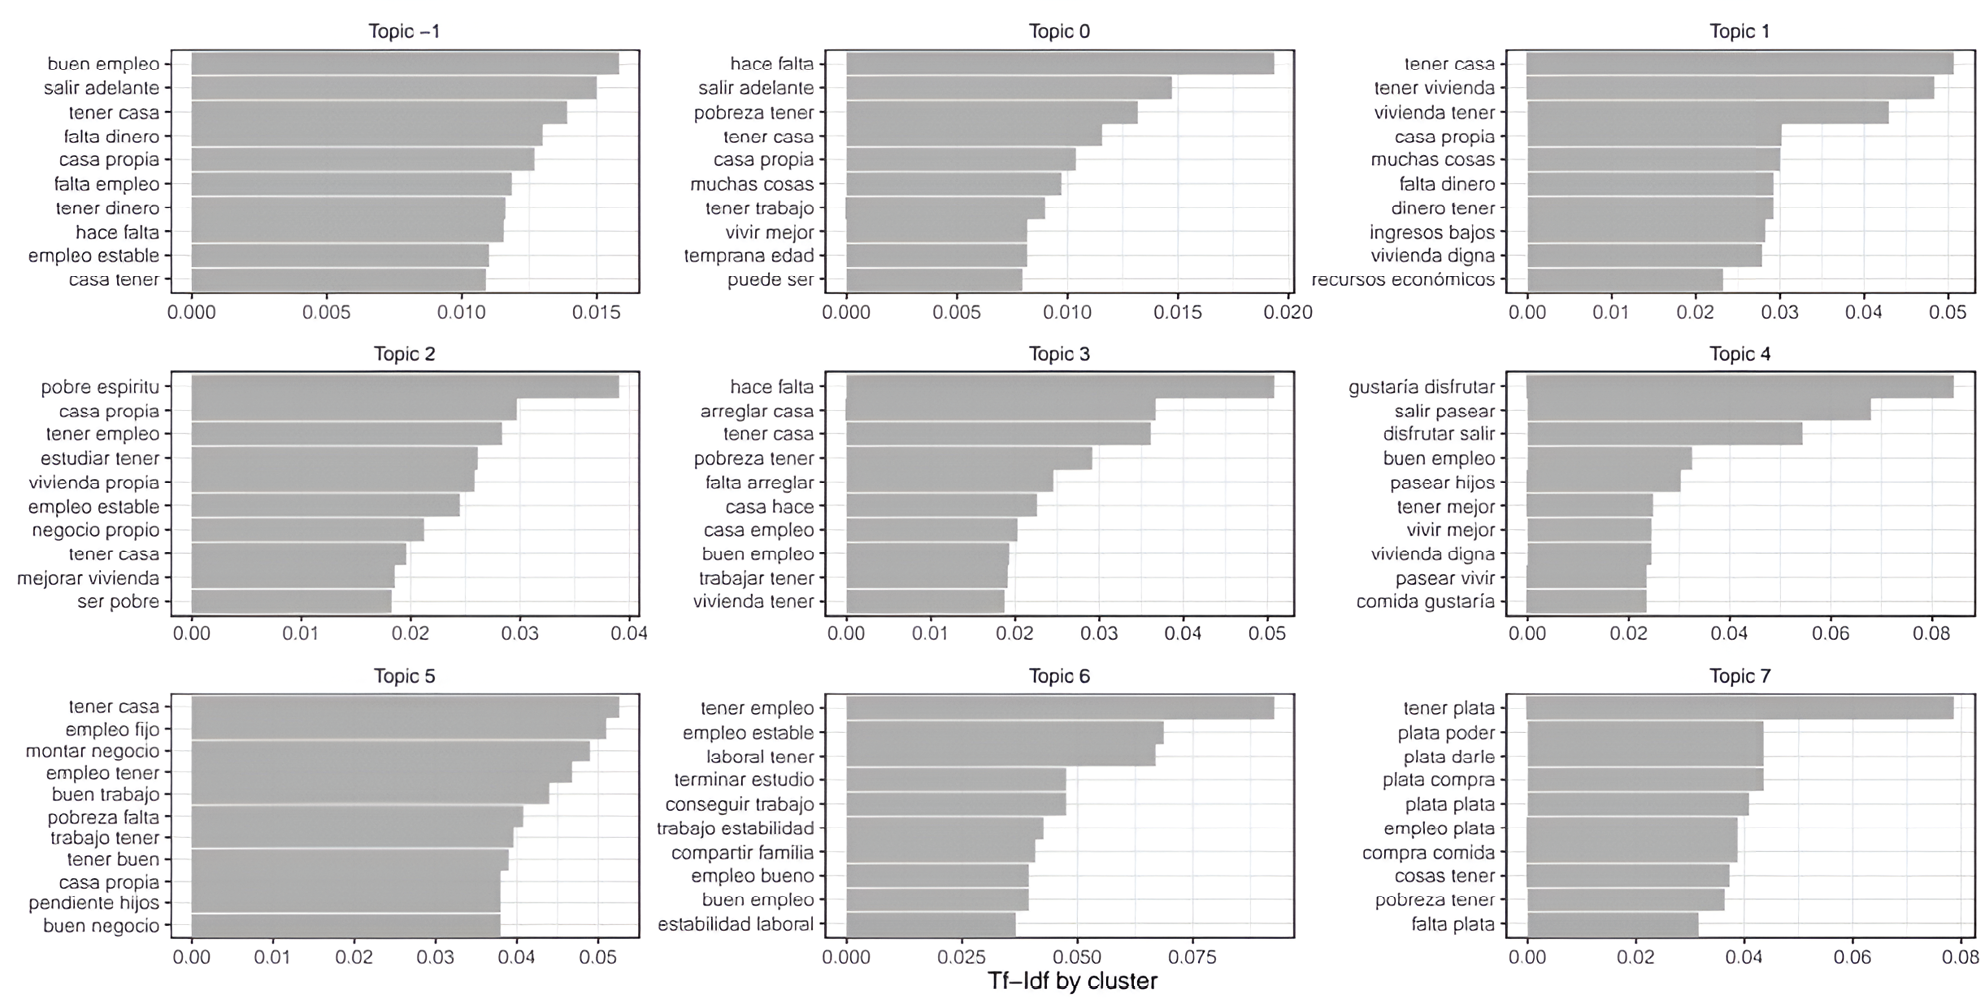
In implementing the BERTopic method, we employed the default xlm-RoBERTa model—a large, publicly available2 multilingual transformer. After generating the embeddings, we performed dimensionality reduction and clustering, subsequently removing stop words to derive an interpretable c-tfidf matrix. BERTopic identified eight clusters within the poverty database (see Figure 8). The largest cluster (106 out of 385 documents), labeled as topic -1, was deemed an outlier, highlighting the similarity among numerous documents and the challenges in clustering semantically akin texts. Topic 0 encompassed 26% of the documents. We analyzed common and uncommon bigrams to validate the semantic themes of deprivation and well-being. Topic -1 included documents detailing prevalent commodity deprivations, which can translate into functional aspects (e.g., owning a house implies security). Key bigrams such as casa propia (owning a house), falta de dinero (lack of money), and tener un buen empleo (have a good job) appeared across multiple topics, while some bigrams were unique, serving as candidate dimensions for perceived deprivation or commodities. Thus, the selected candidate dimensions from the poverty database included: empleo (employment), casa propia (owning a house), salir adelante (getting ahead), dinero (money), salir a disfrutar (going out to enjoy), pobre de espíritu (poverty of spirit), and educación (education).
Figure 8. BERTopic poverty database
Source: The authors.
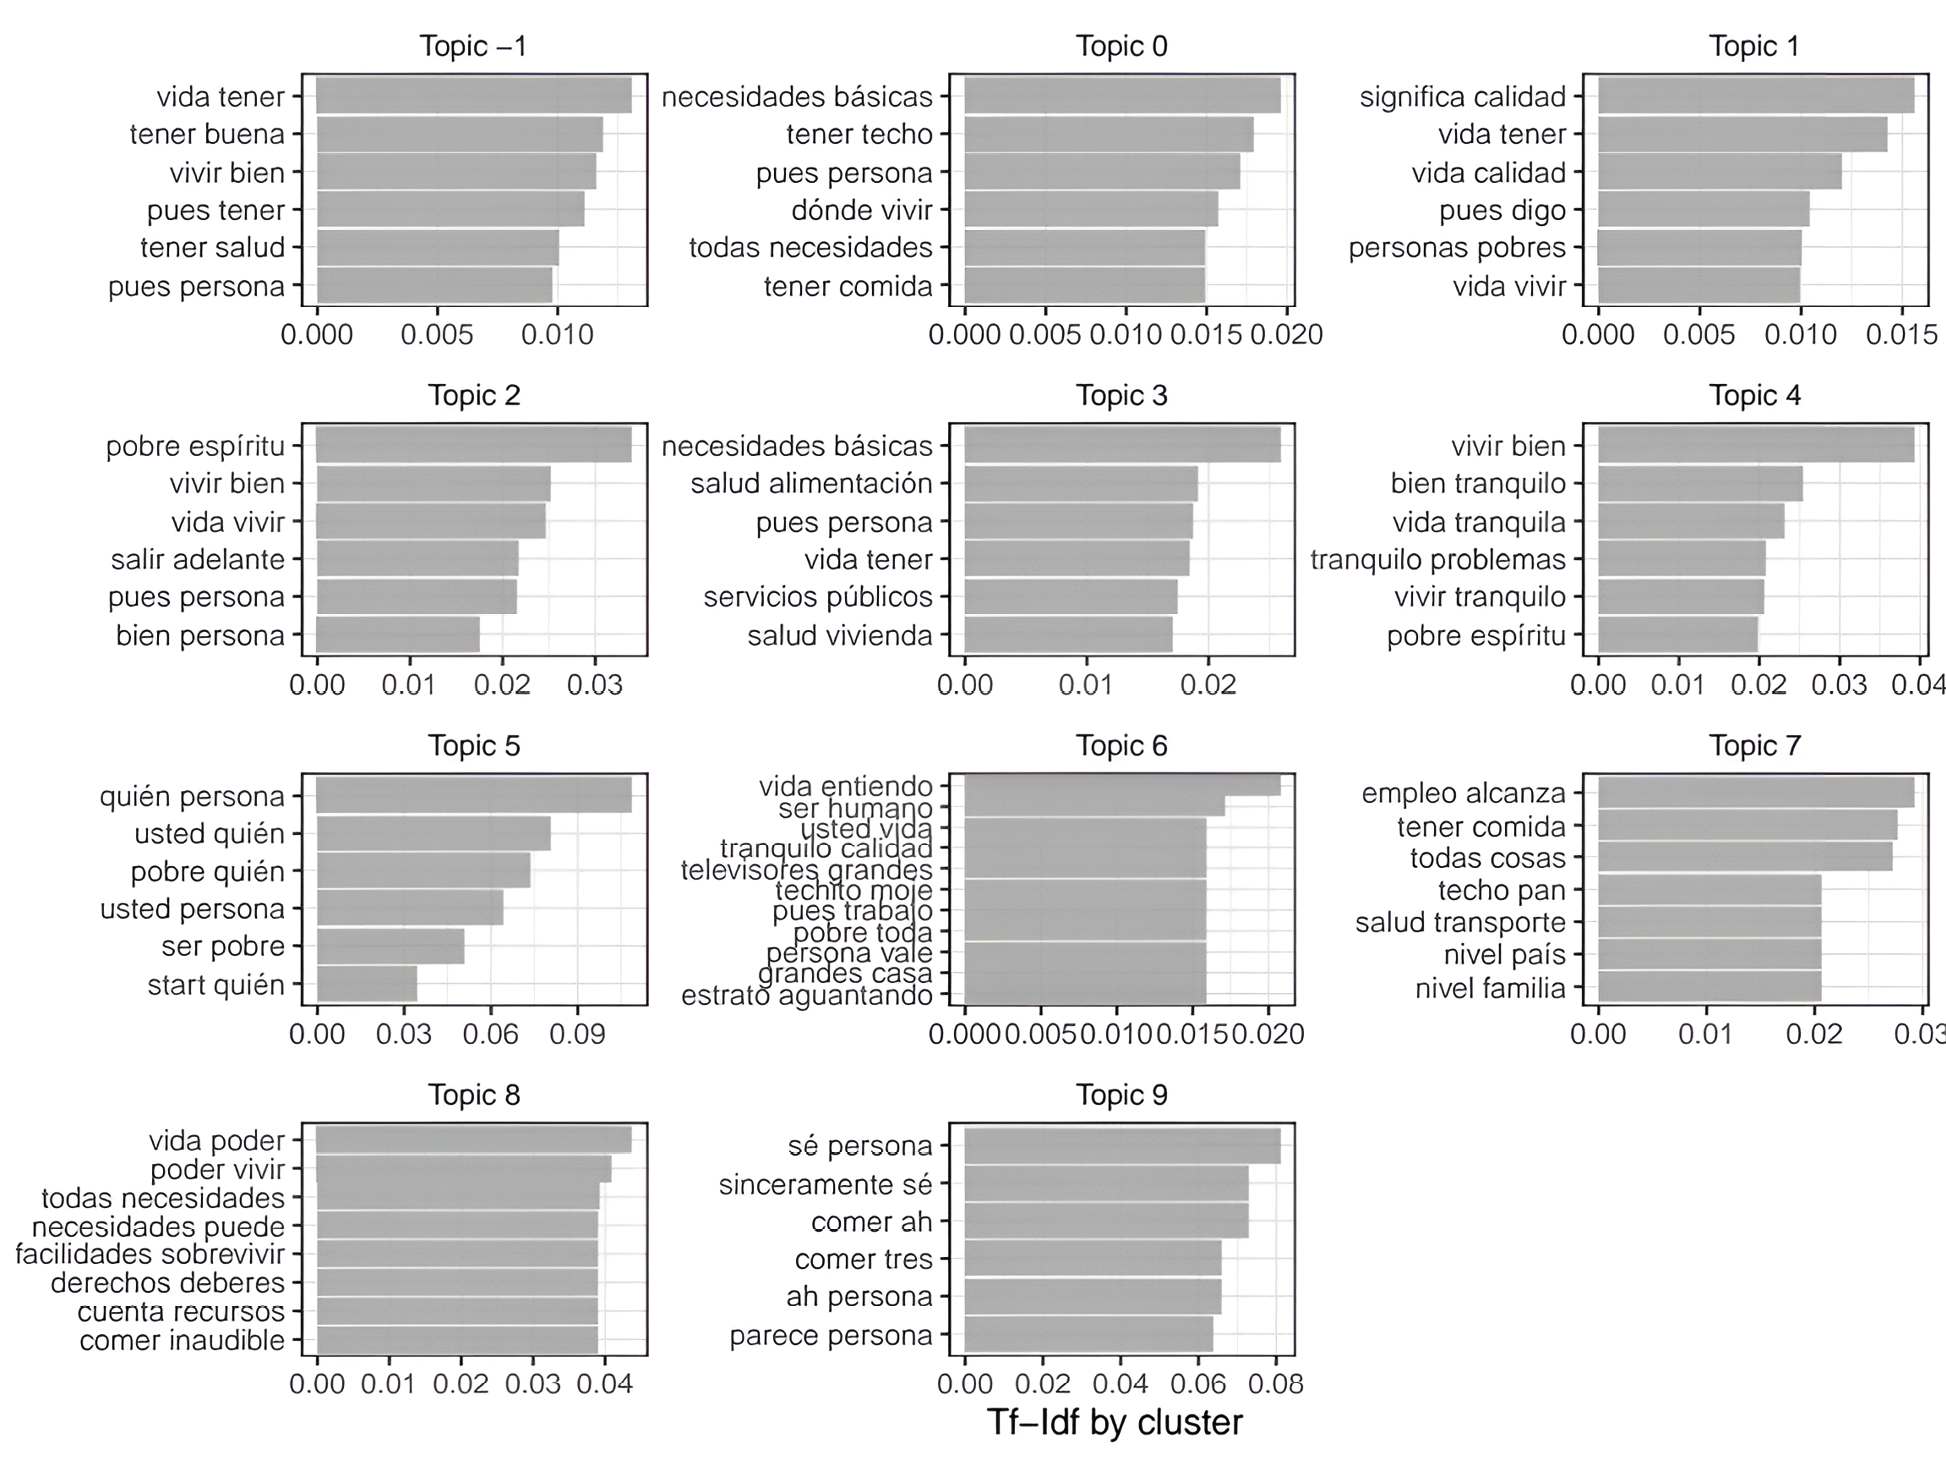
The BERTopic results for the QoL database identified nine clusters (Figure 9). The cluster containing the largest proportion of documents was topic -1 (49%), followed by Cluster 0 with 10.1%. Accordingly, the bigrams of Cluster -1 are likely representative of the overall population. Based on a joint interpretation of topic distribution and semantic evaluation, nine candidate dimensions were identified. The dimension vivir bien (living well) appeared in topics -1, 2, and 4, and was semantically linked to. Also, it is semantically related to poder vivir (being able to live) in topic 8. Another key label extracted from Cluster -1 was tener salud (to have good health). The remaining seven candidate dimensions were present in at least two of the clusters shown in Figure 9: tener techo (having somewhere to live), tener comida (to have food), necesidades básicas (basic needs), salir adelante (getting ahead), pobre de espíritu (poverty of spirit), vivir tranquilo (living in peace), and empleo (employment).
Figure 9. BERTopic for QoL database
Source: The authors.
Experiment 4. Candidate Dimensions and 0Shot-TC
The classification task requires three main parameters to be defined: sequences, candidate labels, and multi-class. Sequences correspond to the text/sequence to be predicted. These are the texts of the respondents’ answers for both poverty and QoL databases. Candidate labels refers to a list of all candidate labels we want to predict, which can be understood in terms of the capability approach as value objects that people value and have reason to value. These labels need not be previously known to the model. In this case, our labels come from previous topic modeling approaches. Finally, for the case of this work, the multi-class parameter is a value that ranges between 0 and 1 (the sum of all classes must be 1), so that it is possible to rank the importance of the labels or dimensions in each text.
The results of the summarized candidate dimensions identified by each method are presented in Tables 3 and 4. The Selected Candidate Dimensions column represents the union set of dimensions extracted by the three methods. This approach was chosen to provide a more comprehensive perspective, leveraging the strengths of each technique and reducing the potential bias of relying on a single method. The column includes both shared and unique dimensions identified by the different techniques, thereby increasing the variance of possible variables and providing a broader view of the social variation in perceptions of deprivation. Nine dimensions were identified for the poverty database and ten for the QoL database. It is worth noting that there are no significant differences between the results obtained by the three methods, which supports the rationale for using the union set approach. The dimensions with the highest weights by the methods referred to the same topics. Moreover, while all methods identified similar high-weight dimensions BERTopic, exhibited better semantic coherence in topic grouping (Figure 11 and Figure 12).
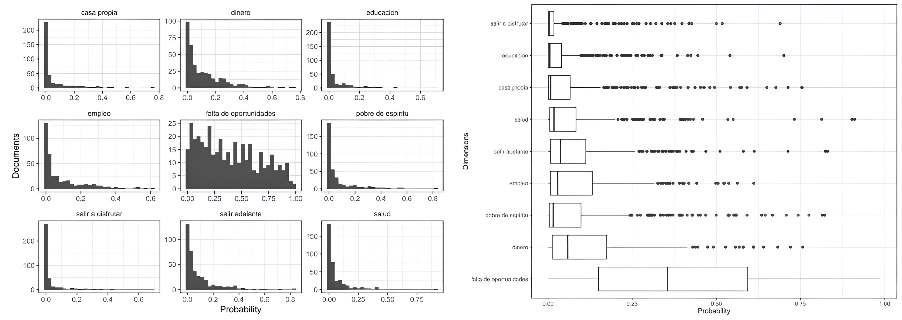
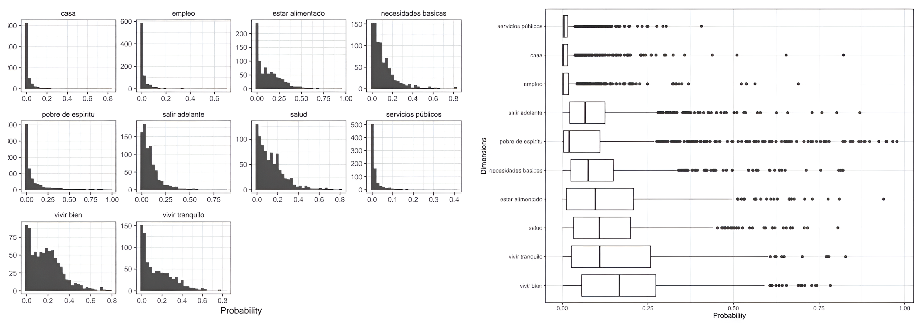
The candidate dimensions were applied in 0Shot-TC to perform the classification, represented by the label probability assigned to the text. Higher values indicate that the 0Shot-TC model identified stronger semantic associations between the text and the given label. The resulting probability distribution are heavy-tailed, with extremely low values at one end. As the distribution moves away from these low values, the corresponding dimension appears more relevant for the group of people (or texts) being analyzed. These distributions help visualize the variability in how important each dimension is perceived to be. Given their heavy-tailed nature and the presence of outliers, the median in the box plots (Figures 10 and 11) offers a more reliable indication of the ranking or relative importance of each dimension.
Table 3. Candidate dimensions by method from Poverty dataset
|
Descriptive perspective |
Correlated topic model |
BERTopic |
Selected candidate labels |
|
Experiment 1 |
Experiment 2 |
Experiment 3 |
|
|
Casa propia (owning a house) |
Casa propia (owning a house) |
Casa propia (owning a house) |
Casa propia (owning a house) |
|
Salir adelante (getting ahead) |
Salir adelante (getting ahead) |
Salir adelante (getting ahead)) |
Salir adelante (getting ahead) |
|
Dinero (money) |
Dinero (money) |
Dinero (money) |
Dinero (money) |
|
Empleo (employment) |
Empleo (employment) |
Empleo (employment) |
Empleo (employment) |
|
Falta de oportunidades (lack of oportunities) |
Falta de oportunidades (lack of oportunities) |
NA |
Falta de oportunidades (lack of oportunities) |
|
Salir a disfrutar (going out to enjoy) |
Salir a disfrutar (going out to enjoy) |
Salir a disfrutar (going out to enjoy) |
Salir a disfrutar (going out to enjoy) |
|
Pobre de espíritu (poverty of spirit) |
Pobre de espíritu (poverty of spirit) |
Pobre de espíritu (poverty of spirit) |
Pobre de espíritu (poverty of spirit) |
|
Educación (education) |
NA |
Educación (education)) |
Educación (education) |
|
Salud (health) |
Salud (health) |
NA |
Salud (health) |
Source: The authors.
Table 4. Candidate dimensions by method from QoL dataset
|
Descriptive perspective |
Correlated topic model |
BERTopic |
Selected candidate labels |
|---|---|---|---|
|
Vivir bien (living well) |
Vivir bien (living well) |
Vivir bien (living well) |
Vivir bien (living well)) |
|
Salud (health) |
Salud (health) |
Salud (health) |
Salud (health) |
|
Buena comida (good food) |
Estar alimentado (to be well nourished) |
Tener comida (to have food) |
Estar alimentado (to be well nourished) |
|
Necesidades básicas (basic needs) |
Necesidades básicas (basic needs) |
Necesidades básicas (basic needs) |
Necesidades básicas (basic needs) |
|
Salir adelante (getting ahead) |
Salir adelante (getting ahead) |
Salir adelante (getting ahead) |
Salir adelante (getting ahead) |
|
Tener casa having somewhere to live) |
Tener casa having somewhere to live |
Tener casa having somewhere to live |
Tener casa having somewhere to live |
|
Pobre de espíritu (poverty of spirit) |
Pobre de espíritu (poverty of spirit) |
Pobre de espíritu (poverty of spirit) |
Pobre de espíritu (poverty of spirit) |
|
Vivir tranquilo (living in peace) |
Vivir tranquilo (living in peace) |
Vivir tranquilo (living in peace) |
Vivir tranquilo (living in peace) |
|
NA |
NA |
Empleo (employment) |
Empleo (employment) |
|
Servicios públicos (public services) |
Servicios públicos (public services) |
Servicios públicos (public services) |
Servicios públicos (public services) |
Source: The authors.
Figure 10. Boxplot Zero-Shot probability with candidate labels from poverty database
Source: The authors.
Figure 11. Boxplot Zero-Shot probability with candidate labels from the QoL database
Source: The authors.
Figure 12. Percentage of sum of probabilities (weights). The poverty database (Left) and quality of life database (Right)
Source: The authors.
Weights of Dimensions
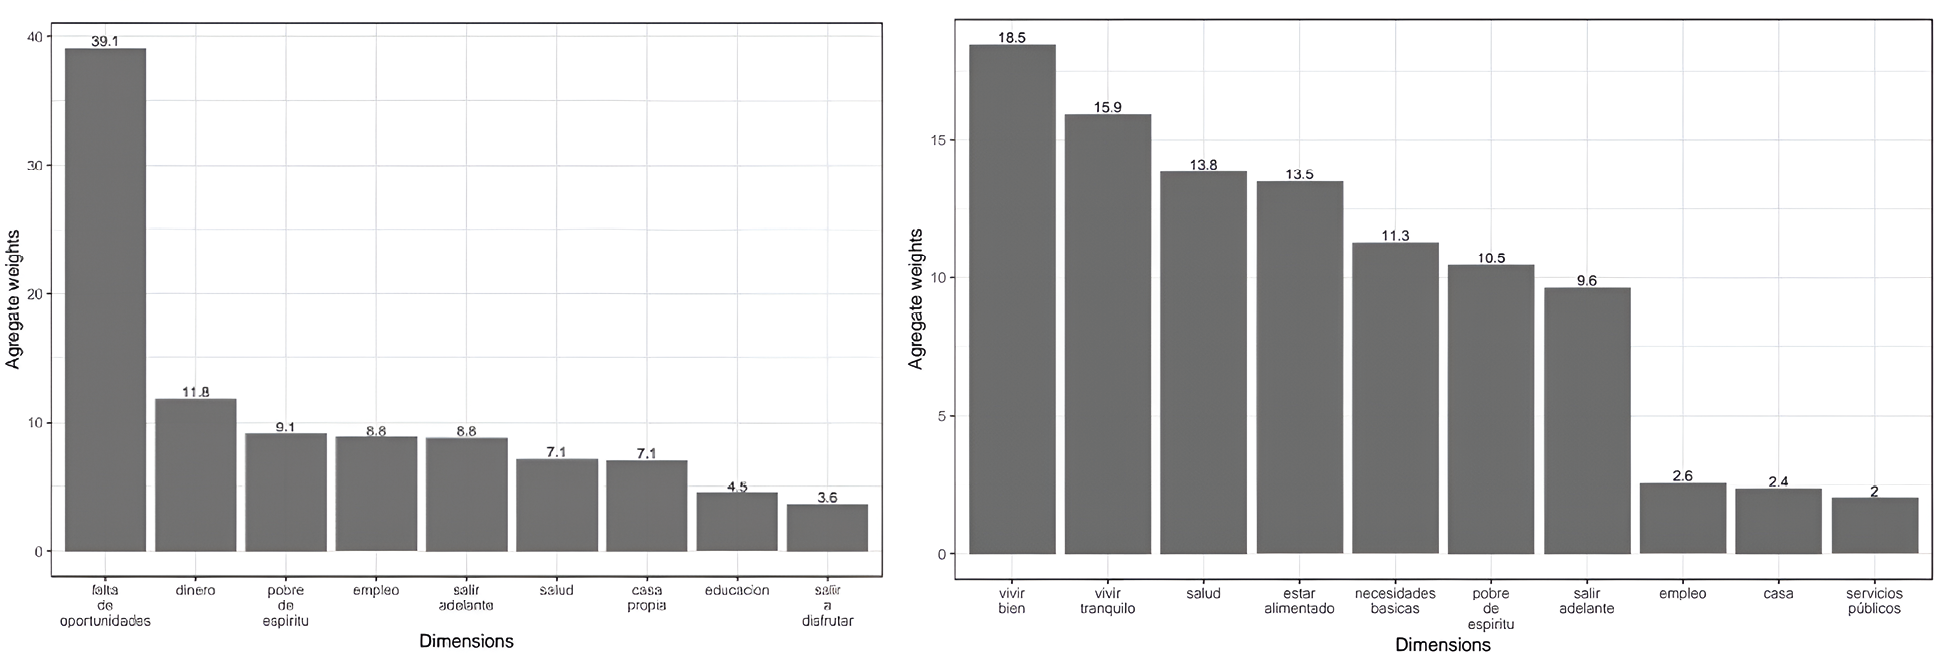
To assign the weight of a given dimension, we performed a simple aggregation operation of the probabilities obtained by each person in each dimension. The sum of each dimension indicates its importance, a high value means that there are people or documents that emphasize that dimension. We then calculated the percentage weight of each dimension based on these sums. Figure 12 presents the results for both the poverty and QoL databases, showing the relative weight of each dimension across the full dataset. In the case of poverty, the three most prominent dimensions are falta de oportunidades (lack of opportunities) (39.1), dinero (money) (11.8), and pobre de espíritu (poverty of spirit) (9.1). The weight of the top dimension exceeds the second most important by over 27 percentage points. For the QoL, the top three most important dimensions are vivir bien (living well) (18.5), vivir tranquilo (living in peace) (15.9), salud (health) (13.9), and estar alimentado (to be well nourished) (13.5). Dimensions related to employment, house, and public services have low weights of less than 2.6 out of a possible 100. These results in both databases represent the topic distribution of the dimensions or labels obtained in the topic modelling phase.
We tested the consistency of the 0Shot-TC model by replacing one candidate dimension at a time while keeping all others constant. The replacements involved synonyms that appeared in the corpus. Specifically, we modified two common terms in both databases: the word house (casa) was replaced with housing (vivienda) and the word employment (empleo) with job (trabajo). The results showed no significant changes in either ranking or magnitude. In the case of housing, the combined results across both databases remained nearly identical. Similarly, when we substituted job for employment, the ranking remained unchanged, and the difference in results was only about one percentage.
The study finds no significant difference among topic modeling methods in extracting dimensions, though BERTopic excels in distinguishing topics based on word semantics due to its attention mechanism and contextual word representations. Simpler descriptive methods for dimension selection are equally effective and easier to implement than transformer-based approaches. Topic modeling yields sets of significant words linked to conceptual fields, with word-concept associations influenced by social context, enabling interpretation of meanings (Halliday 2001). Thus, the findings are specific to poverty and QoL perspectives among Medellín residents, emphasizing the importance of social context in understanding capabilities and freedoms (Robeyns 2020). Our main contribution is the validated methodology presented.
Participants predominantly discussed resources, such as housing and money, rather than functioning impairments. Consistent with Amartya Sen’s (1985) capability approach, the method captures the utilization of commodities. For instance, describing a house as “one’s own” demonstrates the transformation of a resource into a function, such as security, akin to Sen’s (1985) bread example. While this contributes to understanding the conversion process, it may not capture functionings as thoroughly as qualitative studies (Frediani 2019b). This highlights the need to prioritize property rights in housing indicators—a perspective that diverges from Colombian indicators (Angulo et al. 2016), but aligns with Burchi et al. (2021) in recognizing the importance of housing.
This methodology establishes an approach for identifying poverty and well-being dimensions—and their weights—using unsupervised machine learning and NLP algorithms. It overcomes the limitations of consulting closed groups for broader populations and offers opportunities beyond traditional dimension identification and weighting methods (Alkire et al. 2015), thereby supporting innovative approaches (Burchi et al. 2021). Suitable for analyzing large volumes of documents, it enables the identification of overlooked dimensions (Alkire 2007, 2008, and 2013) and provides insight into the voices of the poor, similar to classic studies (Narayan et al. 2000) but enhanced by scalable modern technologies. At the same time, it is recognized that different methodological decisions—such as n-gram selection, topic modeling choices, and candidate dimensions—may lead to variations in the specific dimensions identified and their final weights. Nonetheless, the core emphasis on incorporating participants’ voices remains central to the approach.
The methodology enables the monitoring of shifts in social values, highlighting priority areas for policy interventions and aligning with the well-being agenda of the SDGs (OECD 2021). The results identify context-dependent deprivations and value objects, making the approach particularly relevant for informing poverty or QoL policies (Sen 1992). The dimensions identified can be further refined through participatory processes, helping to address constitutional critiques, and incorporating people’s voices to reflect moral pluralism in constitutions (Burchi, De Muro, and Kollar 2014 and 2018).
By applying big-data algorithms, this methodology reduces biases in dimension selection often associated with power imbalances or educational disparities—limitations frequently found in participatory methods (Nussey et al. 2022). Consistent with the capability approach, its aim is to identify what people prioritize for a valuable life (Sen 1985 and 1992). Through the analysis of everyday language expressions about lacking real opportunities, machine learning and AI techniques offer tools to address challenges in social deliberation and normative validation (Burchi, De Muro, and Kollar 2014).
Additionally, the methodology advances the assessment of dimension weights based on individuals’ everyday language, contributing to the development of hybrid approaches (Alkire et al. 2015; Decancq and Lugo 2013). These weights are derived from normative judgments extracted from texts, revealing hidden valuation patterns rather than explicit expressions. In doing so, the approach supports Sen’s proposal for participatory social decision-making (Sen 2017).
However, the results do not fully resolve the challenge of identifying dimensions solely from the functioning paradigm, as the values identified often relate to resources—such as housing and money—rather than to deprivations or achievements within the functioning space. Still, these findings provide a foundation for in-depth analysis of selected dimensions. Consistent with the capability approach, the realization of functionings depends on how individuals utilize their resources (Sen 1985). This methodology captures information previously obscured by other methods. For example, when a house is described as “one’s own,” it signals a conversion from resource to functioning—highlighting aspects such as security and ownership, and pointing to deeper meanings beyond mere possession (Frediani 2019b). This emphasis contrasts with Colombia’s poverty indicators focusing on material assets (Angulo et al. 2016). Echoing Burchi et al. (2021), housing emerges as a relevant dimension in participatory and survey-based methodologies. Thus, the results of this study provide a foundation for further exploring the characteristics and meanings of resources in context.
This study introduced an innovative modeling approach employing NLP algorithms to extract dimensions and weights from interview data. The methodology was applied to two case studies: one involving interviews about life in poverty and social deprivation, and the other focused on QoL and poverty. Guided by the capabilities approach as the conceptual framework, the research advanced the selection of dimensions and their corresponding weights for developing poverty and QoL indicators.
The results show that the methods used to identify topics or dimensions yielded comparable outcomes across both poverty and QoL contexts. Similar bigrams emerged from the two datasets, reflecting shared concerns among participants. As a result, the dimensions selected as candidate labels for the experiments were largely consistent across both domains. The 0shot-TC analysis indicated that in the poverty case study, falta de oportunidades (lack of opportunities) was the most significant dimension (39.1 out of 100), followed by dinero (money) (11.8) and pobre de espíritu (poverty of spirit) (9.1). In the QoL case study, vivir bien (living well) had a weight of 18.5, followed by vivir tranquilo (living in peace) (19.9), salud (health) (13.8), and estar alimentado (to be well nourished) (13.5).
The study presents several limitations. First, the NLP face challenges in accurately identifying the most valued objects for individuals, as results depend on respondents’ answers and their understanding of the tasks. To ensure a more suitable assessment of well-being, task design should focus on capturing real deprivations rather than utility or subjective happiness (Sen 1985). Moreover, the topic modeling approach did not clearly distinguish resources as means for achieving capabilities. Future research could address this by designing tasks that better reflect geographical contexts of deprivation. Finally, while the dataset used is one of the largest available for Spanish-language NLP tasks related to poverty and QoL, it remains limited in size—highlighting the need for larger and more diverse corpora.
References
- Alkire, Sabina. 2002. Valuing Freedoms: Sen’s Capability Approach and Poverty Reduction. Oxford: Oxford University Press.
- Alkire, Sabina. 2007. “The Missing Dimensions of Poverty Data: Introduction to the Special Issue.” Oxford Development Studies 35 (4): 347-359. https://doi.org/10.1080/13600810701701863
- Alkire, Sabina. 2008. “Choosing Dimensions: The Capability Approach and Multidimensional Poverty.” In The Many Dimensions of Poverty, edited by Nanak Kakwani and Jacques Silber, 89-119. New York: Palgrave Macmillan.
- Alkire, Sabina, and Maria Emma Santos. 2014. “Measuring Acute Poverty in the Developing World: Robustness and Scope of the Multidimensional Poverty Index.” World Development 59: 251-274. https://doi.org/10.1016/j.worlddev.2014.01.026
- Alkire, Sabina, José Manuel Roche, Paola Ballon, James Foster, Maria Emma Santos, and Suman Seth. 2015. Multidimensional Poverty Measurement and Analysis. Oxford: Oxford University Press.
- Angulo, Roberto, Yadira Díaz, and Raúl Andrés Pardo. 2016. “The Colombian Multidimensional Poverty Index: Measuring Poverty in a Public Policy Context.” Social Indicators Research 127 (1): 1-38. https://doi.org/10.1007/s11205-015-0964-z
- Arun, R., V. Suresh, C. E. Veni Madhavan, and M. N. Narasimha Murthy. 2010. “On Finding the Natural Number of Topics with Latent Dirichlet Allocation: Some Observations.” In Advances in Knowledge Discovery and Data Mining, edited by Mohammed J. Zaki, Jeffrey Xu Yu, B. Ravindran, and Vikram Pudi, 391-402. Berlin: Springer. https://doi.org/10.1007/978-3-642-13657-3_43
- Bender, Emily M., Timnit Gebru, Angelina McMillan-Major, and Shmargaret Shmitchell. 2021. “On the Dangers of Stochastic Parrots: Can Language Models Be Too Big?” In Proceedings of the 2021 ACM Conference on Fairness, Accountability, and Transparency, 610-623. March 3-10, Virtual Event, Canada. https://doi.org/10.1145/3442188.3445922
- Biggeri, Mario, Renato Libanora, Stefano Mariani, and Leonardo Menchini. 2006. “Children Conceptualizing Their Capabilities: Results of a Survey Conducted during the First Children’s World Congress on Child Labour.” Journal of Human Development 7 (1): 59-83. https://doi.org/10.1080/14649880500501179
- Blei, David M., Andrew Y. Ng, and Michael I. Jordan. 2003. “Latent Dirichlet Allocation.” Journal of Machine Learning Research 3: 993-1022. https://www.jmlr.org/papers/volume3/blei03a/blei03a.pdf
- Blei, David M., and John D. Lafferty. 2007. “A Correlated Topic Model of Science.” The Annals of Applied Statistics 1 (1): 17-35. https://doi.org/10.1214/07-AOAS114
- Burchi, Francesco, Pasquale De Muro, and Eszter Kollar. 2014. “Which Dimensions Should Matter for Capabilities? A Constitutional Approach.” Ethics and Social Welfare 8 (3): 233-247. https://doi.org/10.1080/17496535.2014.932415
- Burchi, Francesco, Pasquale De Muro, and Eszter Kollar. 2018. “Constructing Well-Being and Poverty Dimensions on Political Grounds.” Social Indicators Research 137 (2): 441-462. https://doi.org/10.1007/s11205-017-1618-0
- Burchi, Francesco, José Espinoza-Delgado, Claudio E. Montenegro, and Nicole Rippin. 2021. “An Individual-Based Index of Multidimensional Poverty for Low- and Middle-Income Countries.” Journal of Human Development and Capabilities 22 (4): 682-705. https://doi.org/10.1080/19452829.2021.1964450
- Cao, Juan, Tian Xia, Jintao Li, Yongdong Zhang, and Sheng Tang. 2009. “A Density-Based Method for Adaptive LDA Model Selection.” Neurocomputing 72 (7-9): 1775-1781. https://doi.org/10.1016/j.neucom.2008.06.011
- Chiquito, Ana Beatriz, Elena Rojas Mayer, Gabriela Llull, Carolina Pinardi, and Lara Barbosa Quadros Côrtes, eds. 2019. La pobreza en la prensa: palabras claves en los diarios de Argentina, Brasil, Colombia y México. Buenos Aires: Clacso.
- Clark, David A. 2000. “Concepts and Perceptions of Development: Some Evidence from the Western Cape.” Southern Africa Labour and Development Research Unit Working Paper No. 88.
- Clark, David A. 2003. “Concepts and Perceptions of Human Well-Being: Some Evidence from South Africa.” Oxford Development Studies 31 (2): 173-196. https://doi.org/10.1080/13600810307428
- Decancq, Koen, and María Ana Lugo. 2013. “Weights in Multidimensional Indices of Wellbeing: An Overview.” Econometric Reviews 32 (1): 7-34. https://doi.org/10.1080/07474938.2012.690641
- Deveaud, Romain, Eric SanJuan, and Patrice Bellot. 2014. “Accurate and Effective Latent Concept Modeling for Ad Hoc Information Retrieval.” Document Numérique 17 (1): 61-84. https://doi.org/10.3166/dn.17.1.61-84
- Devlin, Jacob, Ming-Wei Chang, Kenton Lee, and Kristina Toutanova. 2019. “BERT: Pre-training of Deep Bidirectional Transformers for Language Understanding.” In Proceedings of the 2019 Conference of the North American Chapter of the Association for Computational Linguistics, 4171-4186. June 2-7, Minneapolis, United States. https://aclanthology.org/N19-1423/
- Dumais, Susan T. 2004. “Latent Semantic Analysis.” Annual Review of Information Science and Technology 38 (1): 188-230. https://doi.org/10.1002/aris.1440380105
- Eisenstein, Jacob. 2019. Introduction to Natural Language Processing. Cambridge, MA: MIT Press.
- Frediani, Alexandre Apsan. 2019. “Participatory Research Methods and the Capability Approach: Researching the Housing Dimensions of Squatter Upgrading Initiatives in Salvador da Bahia, Brazil.” In The Capability Approach, Empowerment and Participation: Concepts, Methods and Applications, edited by David A. Clark, Mario Biggeri, and Alexandre Apsan Frediani, 261-288. London: Palgrave Macmillan. https://doi.org/10.1057/978-1-137-35230-9_10
- Fukuda-Parr, Sakiko, and Ismael Cid-Martinez. 2019. “Capability Approach and Human Development.” In The Palgrave Handbook of Development Economics: Critical Reflections on Globalization and Development, edited by Machiko Nissanke and José Antonio Ocampo, 441-468. Cham: Springer. https://doi.org/10.1007/978-3-030-14000-7_13
- Greco, Giulia. 2018. “Setting the Weights: The Women’s Capabilities Index for Malawi.” Social Indicators Research 135 (2): 457-478. https://doi.org/10.1007/s11205-016-1502-3
- Grootendorst, Maarten. 2020. “BERTopic: Leveraging BERT and c-TF-IDF to Create Easily Interpretable Topics.” Version v0.7.0. Zenodo. https://doi.org/10.5281/zenodo.4381785
- Halliday, M. A. K. 2001. El lenguaje como semiótica social: la interpretación social del lenguaje y del significado. Ciudad de México: FCE.
- Lafferty, John D., and David M. Blei. 2006. “Correlated Topic Models.” In Advances in Neural Information Processing Systems 18, edited by Yair Weiss, Bernhard Schölkopf and John Platt. Cambridge, MA: MIT Press.
- Madsen, Andreas, Siva Reddy, and Sarath Chandar. 2021. “Post-hoc Interpretability for Neural NLP: A Survey.” arXiv preprint arXiv:2108.04840. https://doi.org/10.48550/arXiv.2108.04840
- McElreath, Richard. 2020. Statistical Rethinking: A Bayesian Course with Examples in R and STAN. New York: Chapman and Hall/CRC. https://doi.org/10.1201/9780429029608
- Monroe, Burt L., Michael P. Colaresi, and Kevin M. Quinn. 2017. “Fightin’ Words: Lexical Feature Selection and Evaluation for Identifying the Content of Political Conflict.” Political Analysis 16 (4): 372-403. https://doi.org/10.1093/pan/mpn018
- Muñetón-Santa, Gloria, Diana Escobar-Grisales, Felipe Orlando López-Pabón, Paula Andrea Pérez-Toro, and Juan Rafael Orozco-Arroyave. 2022. “Classification of Poverty Condition Using Natural Language Processing.” Social Indicators Research 162: 1413-1435. https://doi.org/10.1007/s11205-022-02883-z
- Narayan, Deepa, Raj Patel, Kai Schafft, Anne Rademacher, and Sarah Koch-Schulte. 2000. Voices of the Poor: Can Anyone Hear Us? Oxford: Oxford University Press.
- Murzin, Nikita. 2020. ldatuning: Tuning of the Latent Dirichlet Allocation Models Parameters. R package. https://github.com/nikita-moor/ldatuning
- Nussbaum, Martha C. 2000. Women and Human Development: The Capabilities Approach. Cambridge: Cambridge University Press.
- Nussbaum, Martha C. 2011. Creating Capabilities: The Human Development Approach. Cambridge, MA: Belknap Press.
- Nussey, Charlotte, Alexandre Apsan Frediani, Rosiana Lagi, Janaína Mazutti, and Jackline Nyerere. 2022. “Building University Capabilities to Respond to Climate Change through Participatory Action Research: Towards a Comparative Analytical Framework.” Journal of Human Development and Capabilities 23 (1): 95-115. https://doi.org/10.1080/19452829.2021.2014427
- OECD (Organisation for Economic Co-operation and Development). 2021. How’s Life in Latin America? Measuring Well-being for Policy Making. Paris: OECD Publishing. https://doi.org/10.1787/2965f4fe-en
- Prabhakaran, Vinodkumar, Ben Hutchinson, and Margaret Mitchell. 2019. “Perturbation Sensitivity Analysis to Detect Unintended Model Biases.” In Proceedings of the 2019 Conference on Empirical Methods in Natural Language Processing and the 9th International Joint Conference on Natural Language Processing, 5740-5745. November, Hong Kong, China. https://doi.org/10.18653/v1/D19-1578
- Reimers, Nils, and Iryna Gurevych. 2019. “Sentence-BERT: Sentence Embeddings Using Siamese BERT-Networks.” Proceedings of the 2019 Conference on Empirical Methods in Natural Language Processing and the 9th International Joint Conference on Natural Language Processing, 3982-3992. November, Hong Kong, China. https://doi.org/10.18653/v1/D19-1410
- Robeyns, Ingrid. 2017. Wellbeing, Freedom and Social Justice: The Capability Approach Re-examined. Cambridge: Open Book Publishers.
- Robeyns, Ingrid. 2020. “Wellbeing, Place and Technology.” Wellbeing, Space and Society 1: 100013. https://doi.org/10.1016/j.wss.2020.100013
- Salton, Gerard, and Christopher Buckley. 1988. “Term-Weighting Approaches in Automatic Text Retrieval.” Information Processing & Management 24 (5): 513-523. https://doi.org/10.1016/0306-4573(88)90021-0
- Salvatore, Camilla, Silvia Biffignandi, and Annamaria Bianchi. 2021. “Social Media and Twitter Data Quality for New Social Indicators.” Social Indicators Research 156: 601-630. https://doi.org/10.1007/s11205-020-02296-w
- Schofield, Alexandra, Michael Magnusson, Lauren Thompson, and David Mimno. 2017. “Understanding Text Pre-Processing for Latent Dirichlet Allocation.” In Proceedings of the 15th Conference of the European Chapter of the Association for Computational Linguistics, vol. 2. Association of Computational Linguistics. https://www.cs.cornell.edu/~xanda/winlp2017.pdf
- Sen, Amartya. 1985. Commodities and Capabilities. Oxford: Oxford University Press.
- Sen, Amartya. 1992. Inequality Reexamined. Cambridge, MA: Harvard University Press.
- Sen, Amartya. 1999. Development as Freedom. Boston: Anchor Books.
- Sen, Amartya. 2004. “Capabilities, Lists, and Public Reason: Continuing the Conversation.” Feminist Economics 10 (3): 77-80. https://doi.org/10.1080/1354570042000315163
- Sen, Amartya. 2009. The Idea of Justice. Cambridge, MA: Harvard University Press.
- Sen, Amartya. 2017. Collective Choice and Social Welfare. Cambridge, MA: Harvard University Press.
- Shaffer, Paul. 2002. “Participatory Analyses of Poverty Dynamics: Reflections on the Myanmar PPA.” In Knowing Poverty: Critical Reflections on Participatory Research and Policy, edited by Karen Brock and Rosemary McGee, 44-68. London: Routledge.
- Sievert, Carson, and Kenneth Shirley. 2014. “LDAvis: A Method for Visualizing and Interpreting Topics.” In Proceedings of the Workshop on Interactive Language Learning, Visualization, and Interfaces, 63-70. June, Baltimore, United States. https://aclanthology.org/W14-3110
- Silge, Julia, and David Robinson. 2017. Text Mining with R: A Tidy Approach. O’Reilly Media.
- Townsend, Peter. 1979. Poverty in the United Kingdom: A Survey of Household Resources and Standards of Living. Los Angeles: University of California Press.
- United Nations. 2015. Transforming Our World: The 2030 Agenda for Sustainable Development. New York: United Nations. https://unctad.org/system/files/official-document/ares70d1_en.pdf
- Vayansky, Ike, and Sathish A. P. Kumar. 2020. “A Review of Topic Modeling Methods.” Information Systems 94: 101582. https://doi.org/10.1016/j.is.2020.101582
- Wisor, Scott, Sharon Bessell, Fatima Castillo, Joanne Crawford, Kieran Donaghue, Janet Hunt, Alison M. Jaggar, Amy Liu, and Thomas Pogge. 2016. The Individual Deprivation Measure: A Gender-Sensitive Approach to Poverty Measurement. Cham: Palgrave Macmillan.
- World Bank. 2018. Poverty and Shared Prosperity 2018: Piecing Together the Poverty Puzzle. Washington D.C.: World Bank. https://www.worldbank.org/en/publication/poverty-and-shared-prosperity-2018
- Yin, Wenpeng, Jiajun Hay, and Dan Roth. 2019. “Benchmarking Zero-shot Text Classification: Datasets, Evaluation and Entailment Approach.” arXiv preprint arXiv:1909.00161. https://doi.org/10.48550/arXiv.1909.00161
✽ This article is based on the first author’s doctoral thesis. This work was supported by the Universidad de Antioquia’s CODI (Comité para el Desarrollo de la Investigación) under project 2024-67391. The authors would like to extend their special thanks to Juan Esteban Sierra-Aguilar and Juan Camilo Vásquez-Correa for their contributions during the conception of this work. Author participation: Guberney Muñetón-Santa: design and conception of the methodology; Carlos Andrés Pérez-Aguirre and Juan Rafael Orozco-Arroyave: implementation of the methodology. This research was conducted with the informed consent of the participants and approved by the Ethics Committee of the Universidad de Antioquia, Colombia.
1 From the R package.
PhD in Computer Engineering, Universidad de Antioquia, Colombia. Associate Professor at Instituto de Estudios Regionales, Universidad de Antioquia, Colombia. Latest publications: “Identificación de la pobreza en Colombia: comparación entre el índice de pobreza multidimensional y el sistema de identificación de beneficiarios de programas sociales” (co-authored), Desarrollo y Sociedad 98: 45-68, 2024, https://doi.org/10.13043/DYS.98.3; and “Predicting Multidimensional Poverty with Machine Learning Algorithms: An Open Data Source Approach Using Spatial Data” (co-authored), Social Sciences 12 (5): 296, 2023, https://doi.org/10.3390/socsci12050296. https://orcid.org/0000-0002-5194-1914 | gubeney.muneton@udea.edu.co
PhD student in Engineering, Universidad Nacional de Colombia, Manizales campus. Latest publications: “Identificación de la pobreza en Colombia: comparación entre el índice de pobreza multidimensional y el sistema de identificación de beneficiarios de programas sociales” (co-authored), Desarrollo y Sociedad 98: 45-68, 2024, https://doi.org/10.13043/DYS.98.3; “Bayesian Dynamic Models to Estimate the Impact of Halting Vehicle Fleets on the Air Quality: A Case Study from Medellín, Colombia” (co-authored), Stochastic Environmental Research and Risk Assessment 38: 4331-4346, 2024, https://doi.org/10.1007/s00477-024-02806-z. https://orcid.org/0000-0003-4937-1163 | caaperezag@unal.edu.co
Ph.D. in Computer Science, Friederich Alexander Universität Erlangen Nürnberg, Germany. Associate Professor at the School of Engineering and researcher at GITA Lab, Universidad de Antioquia, Colombia. Recent publications: “Multimodal Evaluation of Customer Satisfaction from Voicemails Using Speech and Language Representations” (co-authored), Digital Signal Processing 156: 104820, 2025, https://doi.org/10.1016/ j.dsp.2024.104820; and “Dysphagia Screening with sMEG, Accelerometry and Speech: Multimodal Machine ad Deep Learning Approaches” (co-authored), Biomedical Signal Processing and Control 100: 107030, 2025, https://doi.org/10.1016/j.bspc.2024.107030. https://orcid.org/0000-0002-8507-0782 | rafael.orozco@udea.edu.co